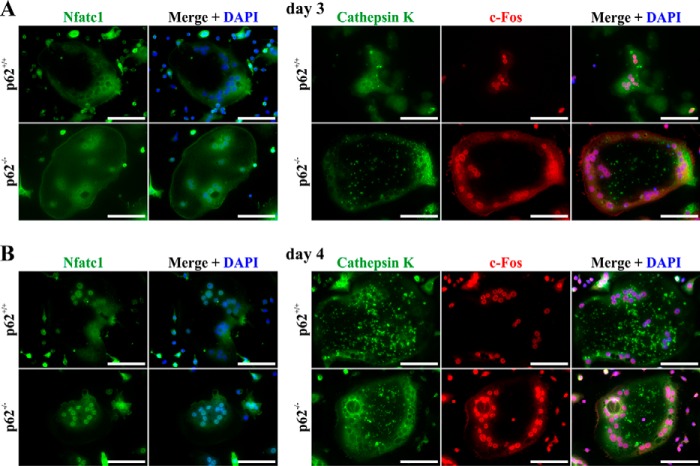
Figure 4.
Representative immunofluorescence microscopy images of Nfatc1-, cathepsin K–, and c-Fos–associated signals in WT- and p62−/−-derived OCs (C57BL/6N) at day 3 (A) or 4 (B) of stimulation with M-CSF/sRANKL. Both cell lines show comparable expression and nuclear translocation of transcription factors c-Fos and Nfatc1 at days 3 and 4 of OCG. Scale bars, 80 μm.

