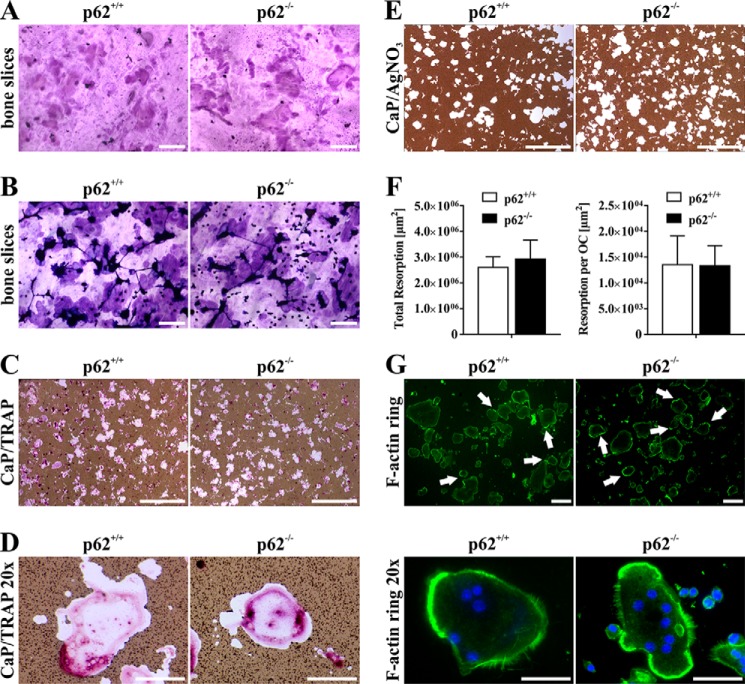
Figure 6.
A and B, representative microscopy images of pit formation assays (functional characterization) using mature p62+/+- and p62−/−-derived OCs (C57BL/6N) seeded on bovine bone slices. Resorption areas were visualized by chemical removal of cells and staining with Mayer's hematoxylin (A) or by direct staining with toluidine blue solution (B). Scale bars, 200 μm. C and D, microscopy images of mature OCs plated on CaP-coated cell culture plates after formalin fixation and TRAP staining in combination with AgNO3 at low (C; scale bars, 1 mm) and high (D; scale bars, 100 μm) magnification. Cells reveal intense TRAP staining and CaP resorption activity regardless of p62 expression. E, representative examples of AgNO3-stained CaP-coated cell culture plates after chemical removal of mature OCs. Scale bars, 1 mm. F, graphic illustration of resorption activity of p62+/+- and p62−/−-derived OCs (left). CaP resorption, normalized to cell number (right), of p62-deficient cells is comparable with p62+/+-derived OCs. Data are displayed as the mean ± S.D. (error bars); n = 3 independent experiments. G, F-actin rings in mature OCs are visualized by FITC-phalloidin (green). Nuclei are counterstained by DAPI (blue). p62+/+- and p62−/−-derived OCs are shown at low (top; scale bars, 200 μm) and high (bottom; scale bars, 100 μm) magnification. White arrows in upper row point to heavily stained areas of F-actin rings.

