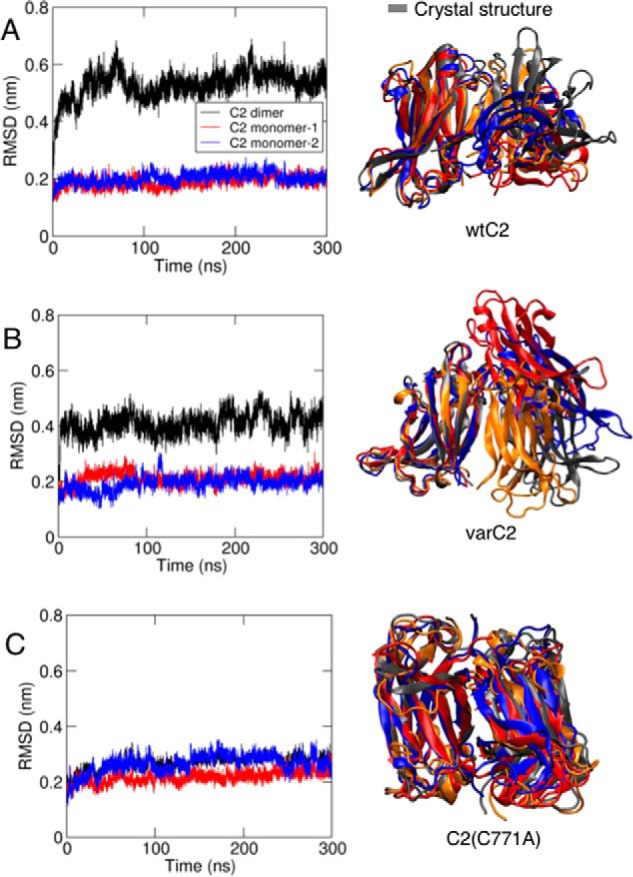
Figure 3.

MD simulation of KIBRA C2 dimer conformation in solution. r.m.s.d. for WTC2 (A), varC2 (B), and varC2(C771A) (C) with r.m.s.d. for the monomers in blue and red and for the dimer in black is shown for one of the simulations of each system. Final structures from the three repeat simulations for each system are also shown with one monomer superimposed, in blue, red, and orange, with the corresponding crystal structure in gray.
