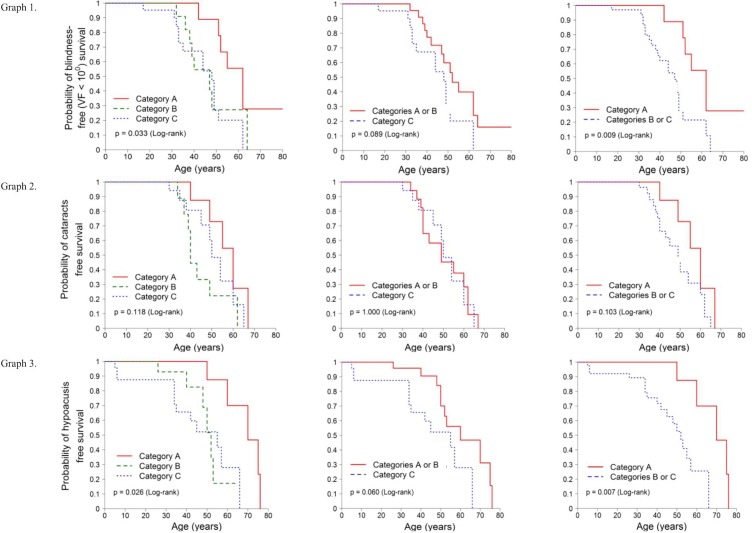
Fig 1. Survival analysis.
Kaplan-Meier survival curves were estimated for each event and the curves of the different groups were compared using the log-rank test. The three categories of patients are considered separately, and then in two new regroupings (Category A + B) and (Category B + C). Category A: p.(Cys759Phe) homozygous, Category B: compound heterozygous p.(Cys759Phe) + USH2A missense variant, and Category C: compound heterozygous p.(Cys759Phe) + USH2A truncating variant. X axis: age in years. Y axis: probability of survival. Graph 1. Survival curve: fraction of patients free of legal blindness due to VF<10° over time. Graph 2. Survival curve: fraction of patients free of cataracts over time. Graph 3. Survival curve: fraction of patients free of hypoacusis over time.

