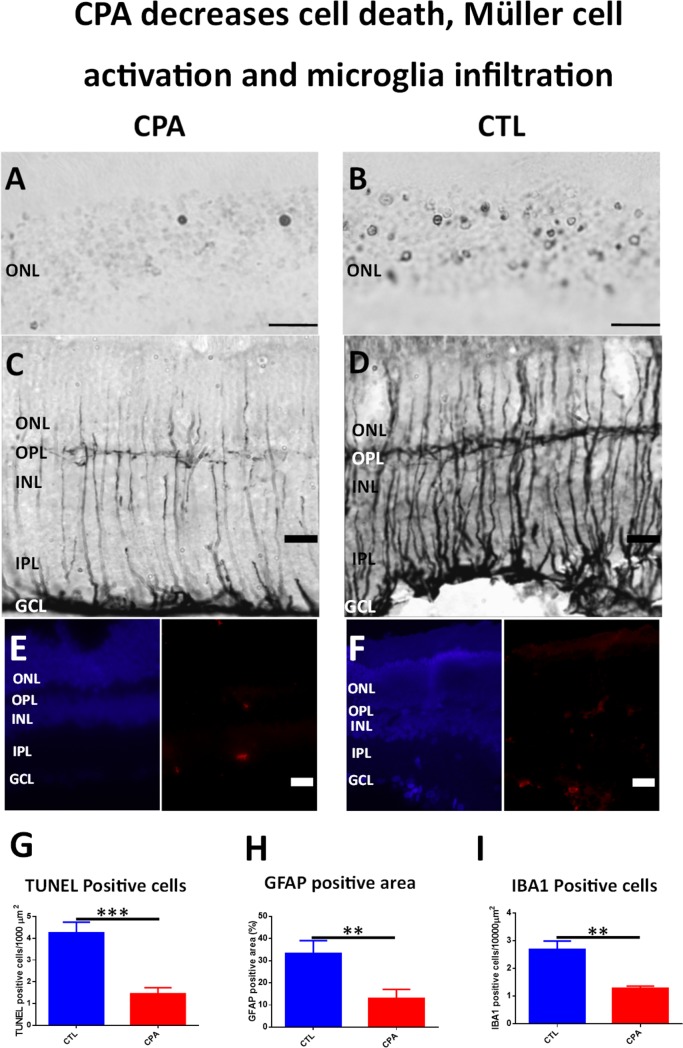
Fig 2. CPA treatment decreases cell death, Müller cell activation and microglial infiltration.
A-B) Microphotograph of representative sections showing TUNEL staining of the outer nuclear layer (ONL) of CPA treated eye (A) and Control eye (B). Only two positive apoptotic nuclei may be observed in the field of CPA treated eye (A) while a huge number of apoptotic nuclei are observed in CTL eye (B). Scale bar: 20μm. C-D) Microphotograph of GFAP immunostained sections of CPA treated eye (C) and Control eye (D). Thin processes of Müller cells are observed in the retina of CPA treated eye (C) while thicker processes of Müller cells are observed in the retina of CTL eye (D).Scale bar: 20μm. E-F) Microphotograph of Hoechst (left, blue) and IBA1 (right, red) stained sections of a CPA treated eye (E) and Control eye (F). A lesser number of IBA1 positive cells are observed in the retina of CPA treated eye (E) while more cells are present in the retina of CTL eye. Scale bar: 20μm. G) Quantification of ONL TUNEL positive cells. CPA treatment produced a significant decrease of ONL positive nuclei when compared to CTL (1.454 ± 0.7376 vs 4.25 ± 1.379 apoptotic nuclei per 1000 μm2; unpaired Student´s t-test p<0.001; n = 8). ***p<0.001. H) Quantification of GFAP positive area staining. CPA treatment produced a significant decrease of GFAP expression when compared to CTL (13.02±10.67% vs control retinas 33.32±15.23%; unpaired Student´s t-test; p<0.01; n = 8). **p<0.01. I) Quantification of IBA1 positive cells. CPA treatment produced a significant decrease of IBA1 positive cells when compared to CTL (1.283 ± 0.1554 vs 2.683 ± 0.6115 IBA1 positive cells per 10000 μm2; unpaired Student´s t-test p<0.01; n = 4). **p<0.01.

