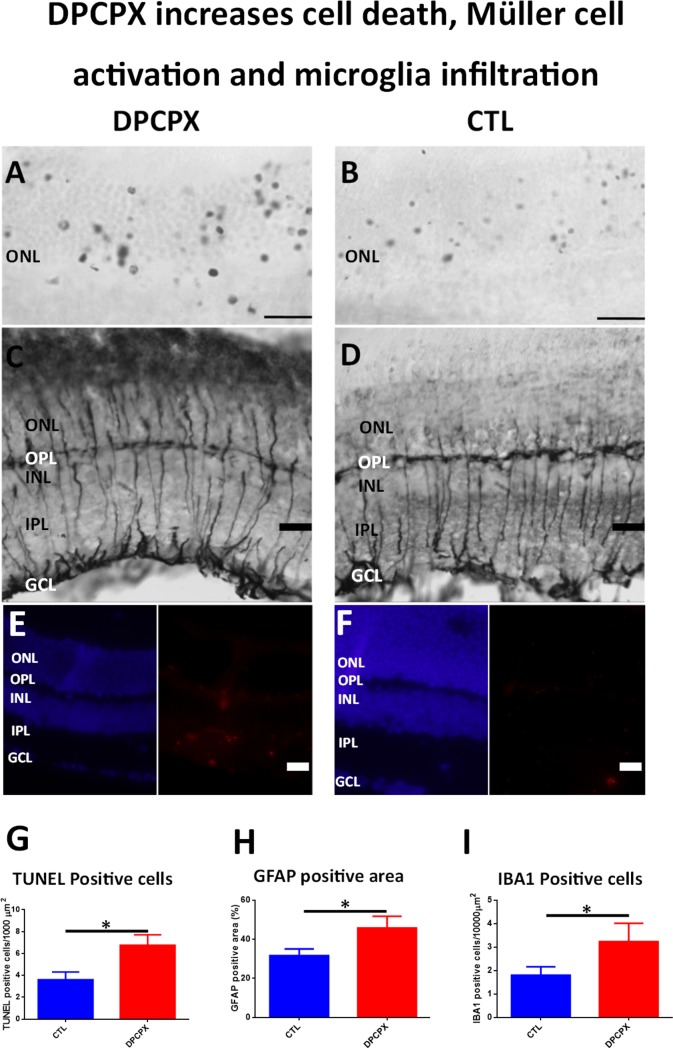
Fig 6. DPCPX increases cell death, Müller cell activation and microglial infiltration.
A-B) Microphotograph of representative sections showing TUNEL staining of the outer nuclear layer of the retina of a DPCPX treated eye (A) and of a CTL eye (B). Observe the important number of apoptotic nuclei in DPCPX treated eye (A) compared to the number of apoptotic nuclei present in CTL eye (B). Scale bar: 20μm. C-D) Microphotograph of GFAP immunostained sections of the retina of a DPCPX treated eye (C) and of a control eye (D). Higher immunoreactivity of Müller cells are observed in the retina of DPCPX treated eye (C) compared to Müller cells in the retina of CTL eye (D).Scale bar: 20μm. E-F) Microphotograph of Hoechst (left, blue) and IBA1 (right, red) stained sections of a DPCPX treated eye (E) and Control eye (F). A higher number of IBA1 positive cells are observed in the retina of DPCPX treated eye (E) compared to those observed in the retina of CTL eye Scale bar: 20μm. G) Quantification of ONL TUNEL positive cells. DPCPX produced a significant rise in ONL positive nuclei when compared to CTL (6.755±2.337 vs 3.608±1.402; unpaired Student´s t-test; p<0.05; n = 8). *p< 0.05. H) Quantification of GFAP positive area staining. DPCPX produced a significant rise in GFAP expression when compared to CTL (45.75±16.1% vs 31.69±10.15%; unpaired Student´s t-test; P<0.05; = 4). *p< 0.05. I) Quantification of IBA1 positive cells. DPCPX treatment produced a significant increase of IBA1 positive cells when compared to CTL (3.235 ± 1.356 vs 1.801 ± 0.8941 IBA1 positive cells per 10000 μm2; unpaired Student´s t-test p<0.05; n = 4). *p<0.05.

