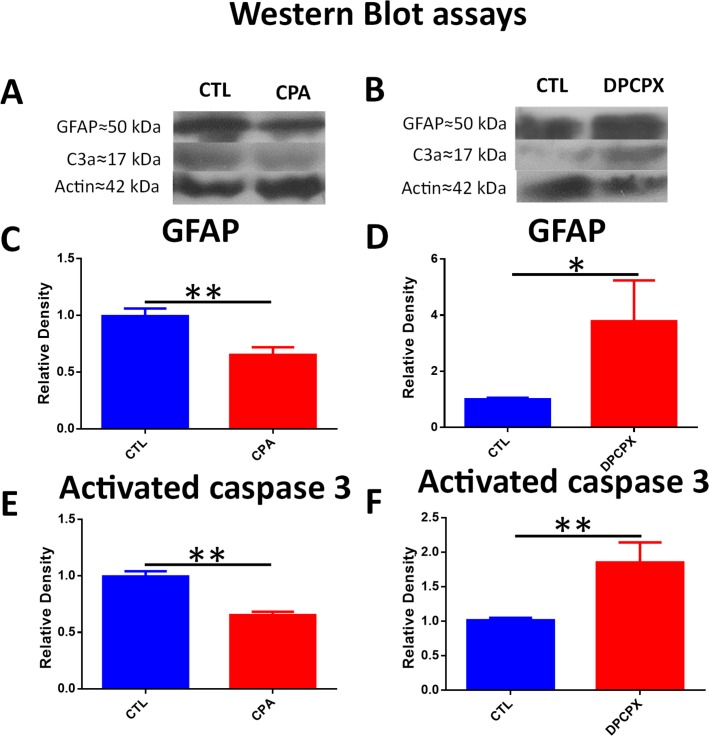
Fig 7. CPA treatment lowered activated caspase 3 and GFAP levels while DPCPX increased activated Caspase 3 and GFAP levels.
A) Representative Western Blot of CPA and CTL treated eyes (cropped blots are displayed). From top to bottom bands correspond to GFAP, Actin and C3a. B) Representative Western Blot of DPCPX and CTL treated eyes (cropped gels/blots are displayed). From top to bottom bands correspond to GFAP, Actin and C3a. C) Quantification of GFAP by WB. CPA produced a highly significant decrease of GFAP relative density compared to CTL (0.652 ± 0.117 vs 0.993 ± 0.1329; unpaired t-test; p<0.01; n = 4), **p<0.01. D)Quantification of GFAP by WB. DPCPX produced a significant rise in GFAP relative density compared to CTL (3.785 ± 2.515 vs 1.00 ± 0.108; unpaired Student´s t-test; p<0.05; n = 4), *p< 0.05. E) Quantification of C3a by WB. CPA produced a highly significant decrease of C3a relative density compared to CTL (0.6527±0.03 vs 0.996±0.04; unpaired Student´s t-test; P = 0.001; n = 4), **p<0.01. F) Quantification of C3a by WB. DPCPX produced a highly significant rise in C3a relative density compared to CTL (1.85±0.5 vs 1.01±0.07; unpaired Student´s t-test; p<0.01; n = 4), **p<0.01.

