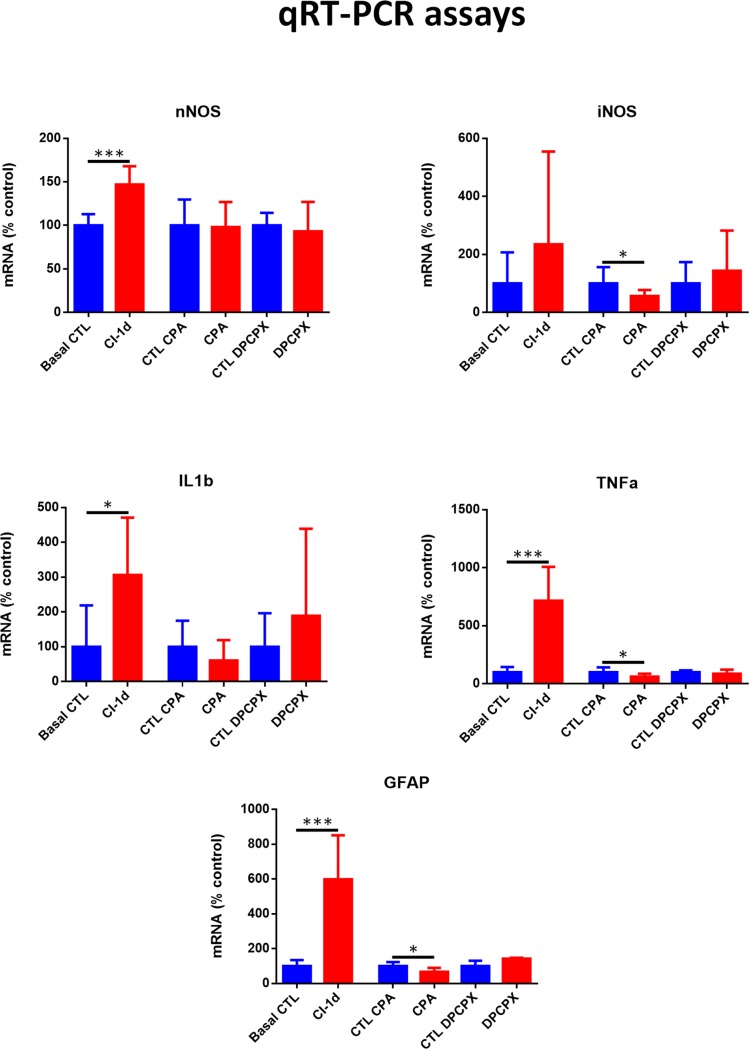
Fig 12. qRT-PCR of nNOS, iNOS, IL-1β and TNF α and GFAP mRNAs.
Figures show mRNA expression of the retinas of unilluminated rats (Basal control), rats exposed to 1d of CI (CI 1d) and of rats treated with CPA or DPCPX or vehicle solutions (CTL CPA or CTL DPCPX) and then exposed to 1d of CI. Values are compared to their respective controls. Determinations were performed after exposure of the rat to one day of continuous illumination. A) nNOS, B) iNOS, C) IL-1β, D) TNF α and E) GFAP, bars represent mean ± SD, unpaired Student´s t-test, *p< 0.05, ***p<0.001.

