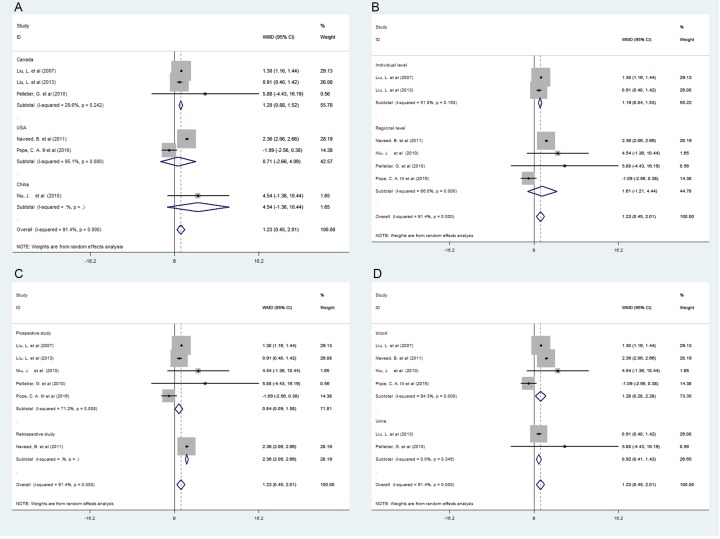
Fig 3. Forest plots for the association between PM2.5 exposure (per 10 μg/m3 increments) and VEGF(β,95%CI) in different subgroups.
(A) The association of PM2.5 exposure and VEGF in Canada, the United States, and China. (B) The association of PM2.5 exposure and VEGF at the individual level with the regional level. (C) The association of PM2.5 exposure and VEGF in the prospective and retrospective study. (D) The association of PM2.5 exposure and VEGF in blood and urine.

