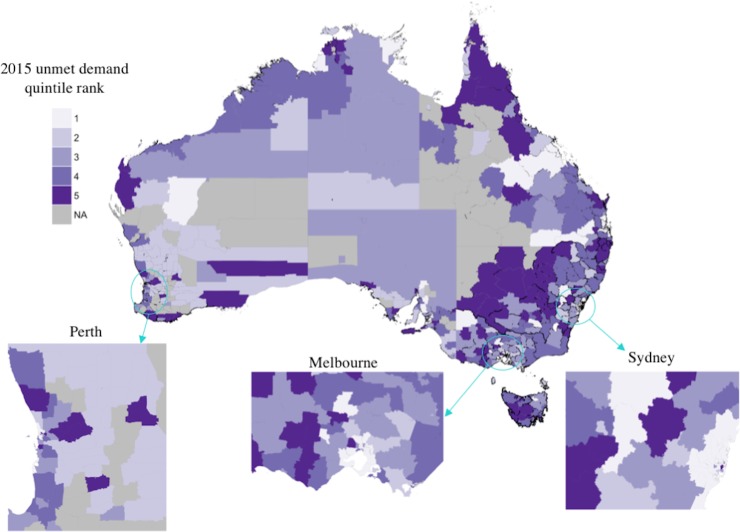
Fig 5. Quintile rank of 2015 unmet demand index by Australian Local Government Area.
Quintile 1 indicates the 20% of LGAs with the least unmet demand. LGAs removed from the analysis are indicated in grey. Adapted from [33] under a CC BY license, with permission from the Commonwealth of Australia, original copyright 2016.

