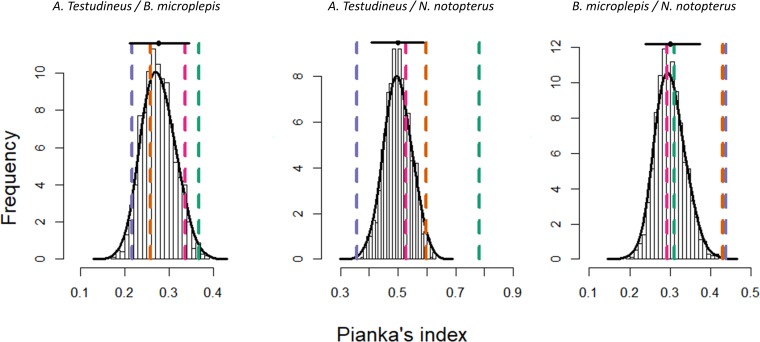
Fig 4. Results from the bootstrap procedure conducted on Pianka’s symmetric index, measuring the degree of niche overlap between the diets of two species.
Histograms present the generated distribution of Pianka’s index between two species under the null hypothesis that there is no seasonal variation in dietary overlap. At the top of each histogram, the black horizontal bar represents the 95% confidence interval of the distribution while the black dot represents the average of the distribution. Colored vertical dashed lines point to the observed measure of niche overlap between two species in each season: receding season = green; wet season = orange; rising season = purple; dry season = pink. Any vertical line not overlapping the horizontal black line indicate a significant difference in the niche overlap for the corresponding season.

