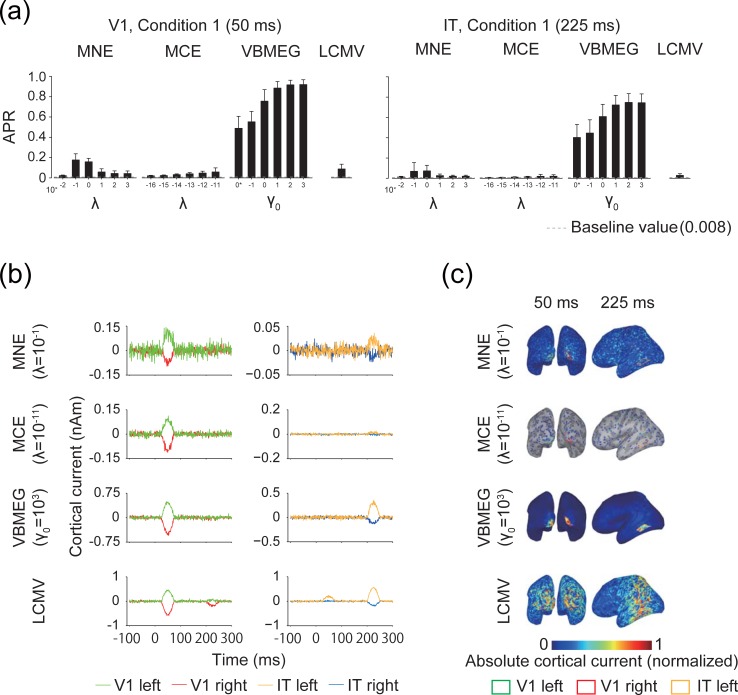
Fig 3. Accuracy of source localization.
(a) Area under the precision-recall (APR) curves for V1 at 50 ms and IT at 225 ms in artificial experimental condition 1 (averaged across participants; error bars, s.d.; gray dashed lines, baseline value of APR). 0* indicates γ0 = 0. Results for artificial experimental condition 2 are shown in S2 Fig. (b) Time course of the mean estimated cortical current within V1 and IT with the hyperparameters that achieved the highest APR. The results for artificial experimental condition 1 for a single participant are shown as examples. (c) Absolute values of estimated cortical current with amplitude normalized to 0–1 for visibility. Vertices showing zero amplitude are set as transparent, and sulci (dark gray) and gyri (light gray) are visible on the maps. Results are shown for the same hyperparameters and participant as in (b).

