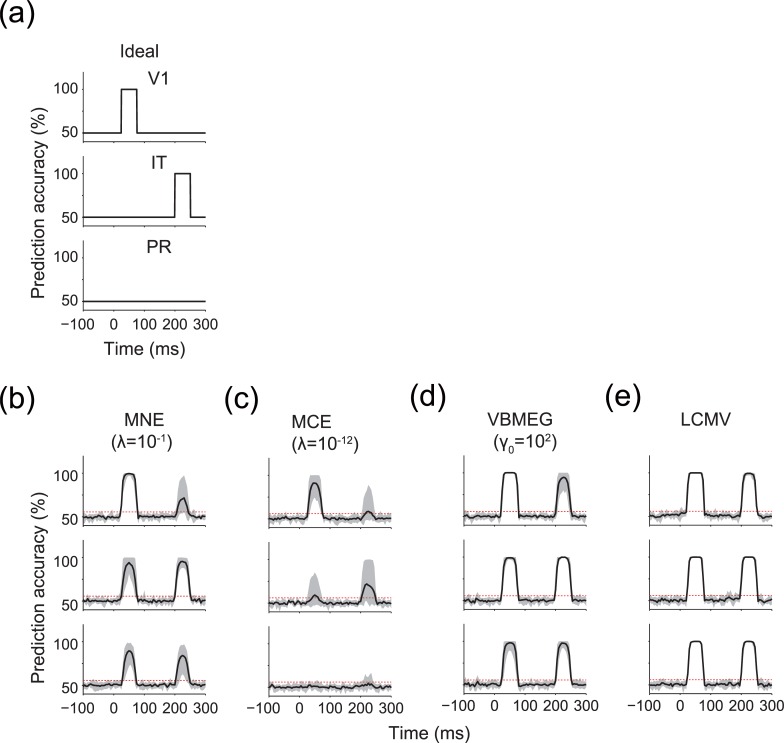
Fig 5. Time-resolved decoding in each ROI.
(a) Ideal time courses of prediction accuracy. (b–e) Time courses of prediction accuracy for MNE, MCE, VBMEG, and LCMV, respectively. Results for the hyperparameters that achieved the highest correlation coefficient in V1 (see Fig 4) are shown. Solid lines indicate the mean prediction accuracy across participants. Shading indicates the 1st–99th percentiles of the prediction accuracy across participants. Red dashed lines indicate the mean significance level across participants. Results for other hyperparameters are shown in S4 Fig.

