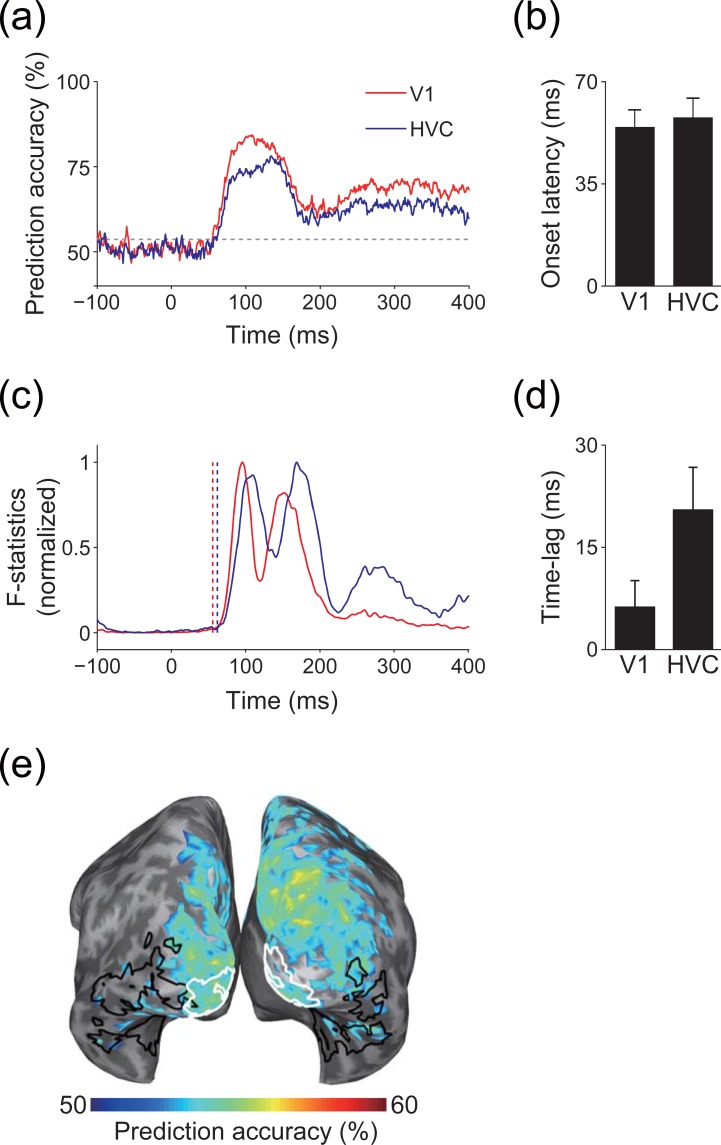
Fig 7. Information spreading in real data analysis.
(a) Time course of prediction accuracy. Solid lines indicate prediction accuracy for V1 (red) and HVC (blue), respectively. Gray dashed line indicate significance level. Results of a single participant (participant 1) are shown as examples. (b) Mean onset latency of significant prediction accuracy for each ROI (error bars, s.d. across participants). (c) Time course of F-statistics. F-statistics are normalized to 0–1 for visibility. Vertical dashed lines indicate the onset of prediction accuracy for each ROI (red, V1; blue, HVC). Results of a single participant (participant 1) are shown as examples. (d) Mean lag of cross-correlation between the time course of prediction accuracy and F-statistics (error bars, s.d. across participants). Positive values indicate that prediction accuracy precedes the F-statistics. (e) Searchlight decoding. Cortical areas that showed significant prediction accuracy are colored. White and black enclosed areas are V1 and HVC, respectively. Results of a single participant (participant 1) are shown as an example. Results of other participants for (a), (c), and (e) are shown in S10A, S10B and S10C Fig, respectively.

