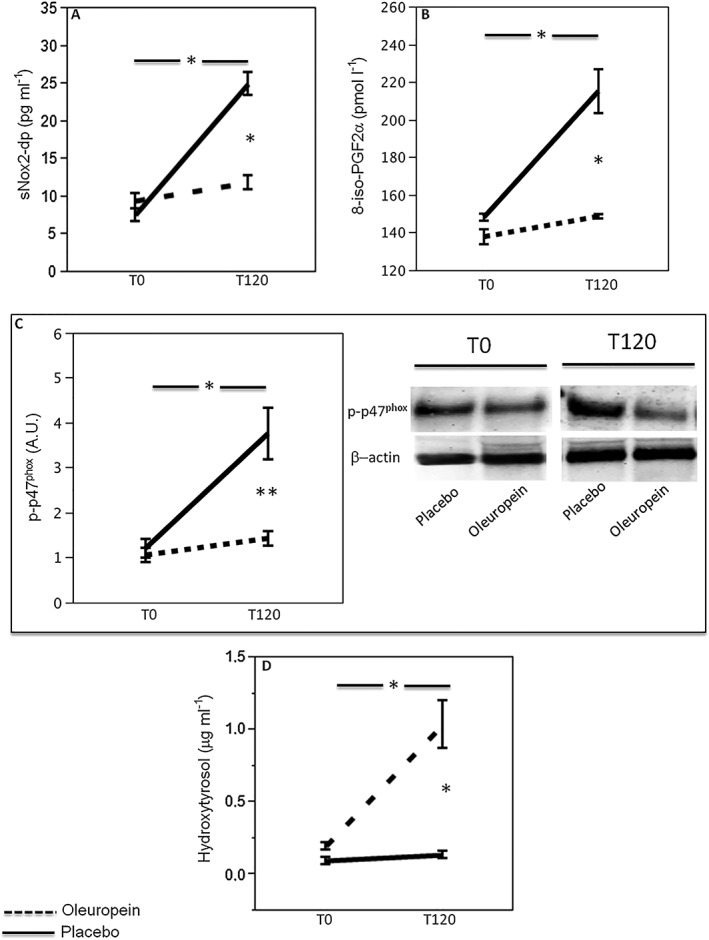
Figure 2.

Effect of oleuropein on oxidative stress biomarkers. sNox2‐dp (n = 20; A), 8‐iso‐PGF2a (n = 20; B), platelet p47phox phosphorylation (n = 5) densitometry with a representative western blot band (C) and plasma concentration of hydroxytyrosol (D) before (T0) and 2 h after meal (T120) in healthy subjects supplemented with 20 mg oleuropein (black dotted line) or 20 mg placebo (black line; *P < 0.001; **P < 0.05)
