
Figure 3.
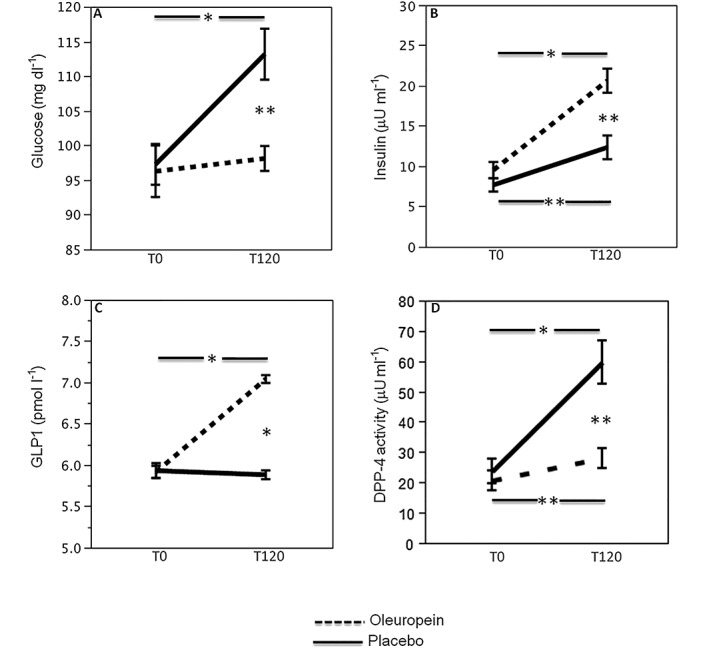
Effect of oleuropein on glycaemic profile. Blood glucose (A), insulin (B), GLP1 (C), DPP‐4 activity (D) before (T0) and 2 h after meal (T120) in healthy subjects (n = 20) supplemented with 20 mg oleuropein (black dotted line) or 20 mg placebo (black line; *P < 0.001; **P < 0.05)