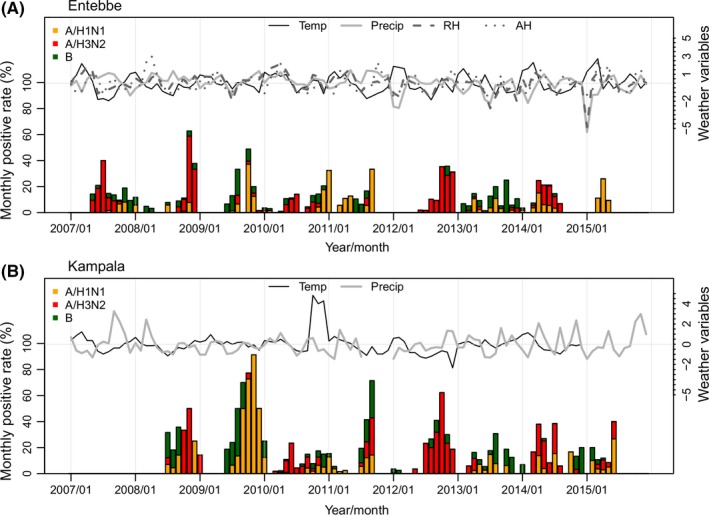
Figure 1.

Monthly viral positive rates for different influenza viruses (y‐axis on the left) and weather variables (y‐axis on the right) in Entebbe and Kampala. Weather variables are standardized to have zero mean and unit variance. Humidity data (RH and AH) are not available for Kampala
