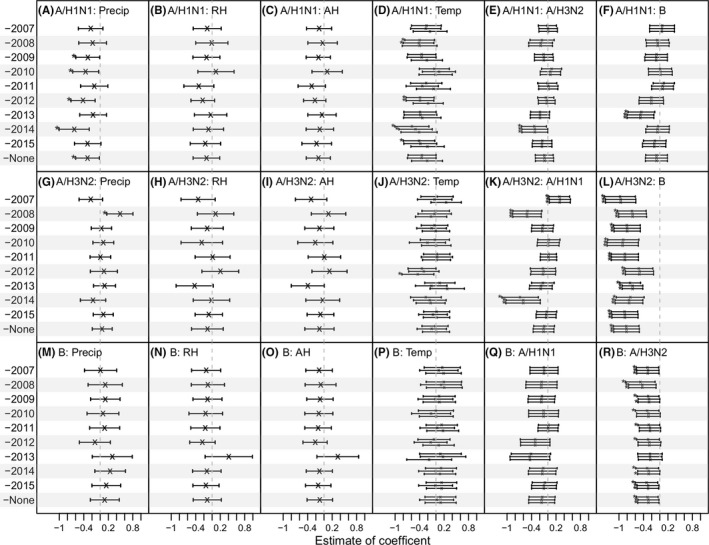
Figure 3.

Estimated inter‐(sub)type interactions and association of influenza epidemics with weather variables adjusted for co‐circulating (sub)types in Entebbe during 2007‐2015. Model coefficients estimated in the leave‐one‐out cross‐validation and over the entire study period are shown for A/H1N1 (1st row: A‐F), A/H3N2 (2nd row: G‐L), and B (3rd row: M‐R). The year left out in the cross‐validation is shown on the y‐axis (eg, “‐2007” indicates data for Year 2007 were excluded, and “‐none” indicates data for the entire study period were included). The associations with precipitation (Precip), relative humidity (RH), absolution humidity (AH), and temperature (Temp) are shown in columns 1 to 4, and (sub)type interactions are shown in columns 5 and 6; the vertical segments show the 95% confidence intervals for each variable; “x”s denote the mean, and “*”s indicate variables significant at the 5% level. For temperature (4th column), 3 estimates are shown for each dataset, corresponding to the 3 models using 1 of the 3 humidity variables (ie, precipitation, RH, and AH)
