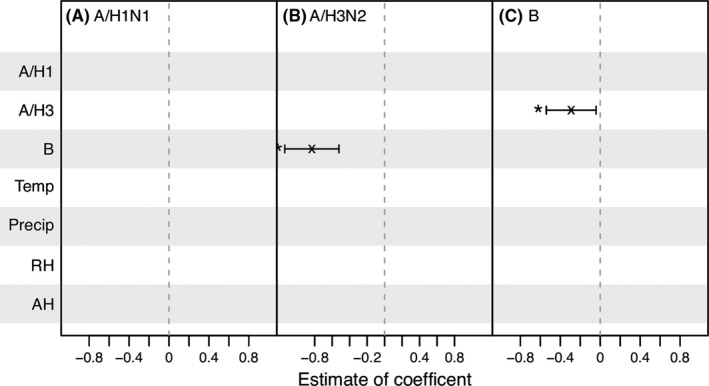
Figure 4.

Best‐fit models for influenza epidemics in Entebbe during 2007‐2015. The variables tested are shown on the y‐axis. Coefficient estimates are shown for variables included in the best‐fit models (ie, the ones with the lowest BIC); the vertical segments show the 95% confidence intervals; “x”s denote the mean and “*”s indicate predictors significant at the 5% level. For instance, for A/H1N1 (1st column), no vertical segments appear, indicating the best‐fit model for A/H1N1 includes none of the tested variables; for A/H3N2 (2nd column), only 1 vertical segment, corresponding to concurrent B activity (labeled on the y‐axis), appears, indicating among the tested variables concurrent B activity is the only variable included in the best‐fit model
