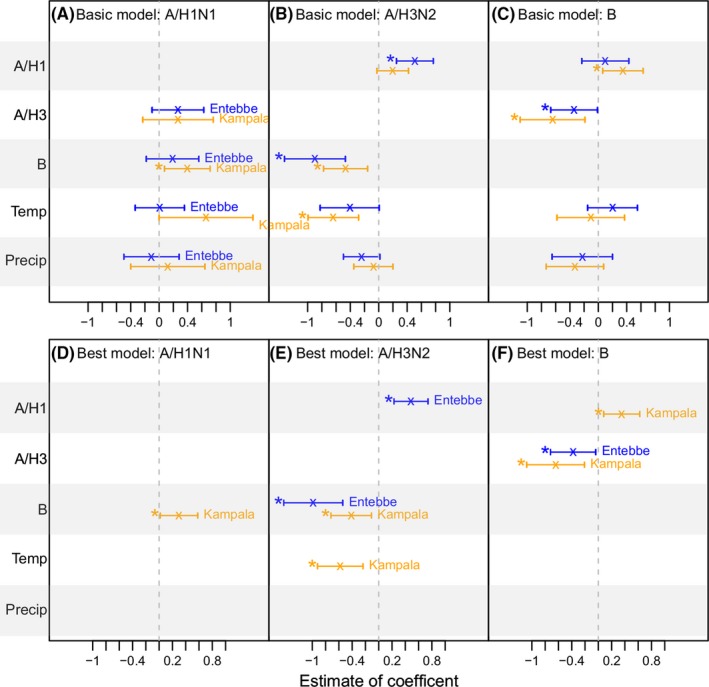
Figure 5.

Comparison of estimated associations with weather variables and inter‐(sub)type interactions in Entebbe and Kampala. The upper panel (A‐C) shows estimates by the basic models specified in Equation (2), and the lower panel (D‐F) shows estimates by the best‐fit models (ie, the ones with the lowest BIC) among all tested models. The predictors are labeled along the y‐axis; the vertical segments show the 95% confidence intervals for each predictor for Entebbe (in blue) and Kampala (in orange); “x”s denote the mean and “*”s indicate predictors significant at the 5% level
