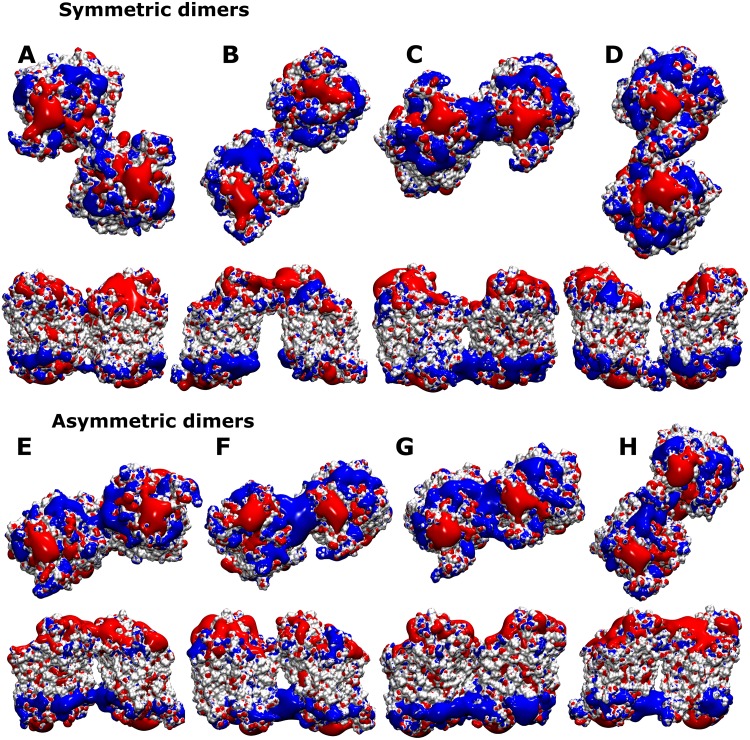
Fig 7. Electrostatic fields.
A cytosolic view and a side view is shown for a representative hDAT dimer structure for each cluster, indicated by the labels A-H. The hDAT surfaces are shown in white, while fields generated are shown in blue (positive potential) and red (negative potential). Potential surfaces are drawn at 2eV.

