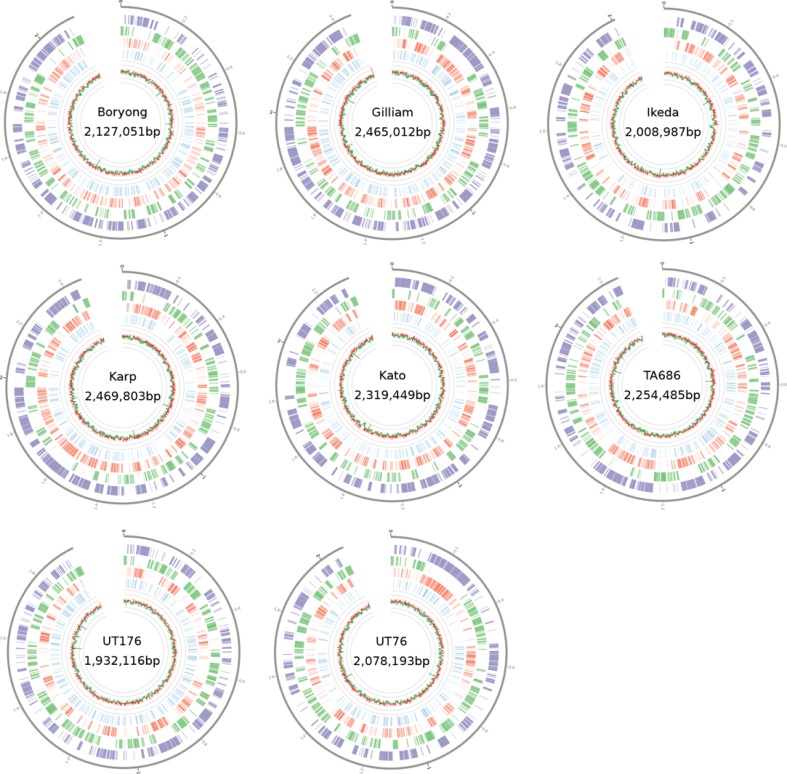
Fig 1. Ring diagrams for all single-contig strains.
From outermost feature in each genome, moving inwards: repetitive regions are shown in purple, core genes in green, repeat genes in red and pseudogenes in blue. The track shows the GC percentage in windows of 1000bp. Values above the median GC are in green, and values below the median GC are in red.

