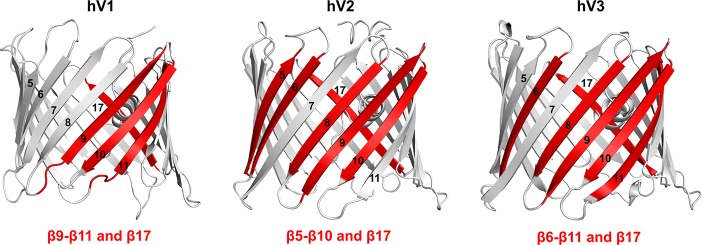
Figure 4.
Aggregation hot spots of hV1, hV2, and hV3. Aggregation hot spots identified in this study are highlighted on the cartoon representation of the three hVDAC isoform structures. hV2 and hV3 structures were modeled using hV112 as the template. Aggregation prone β-strands are in red, and strand numbers are marked on each figure.

