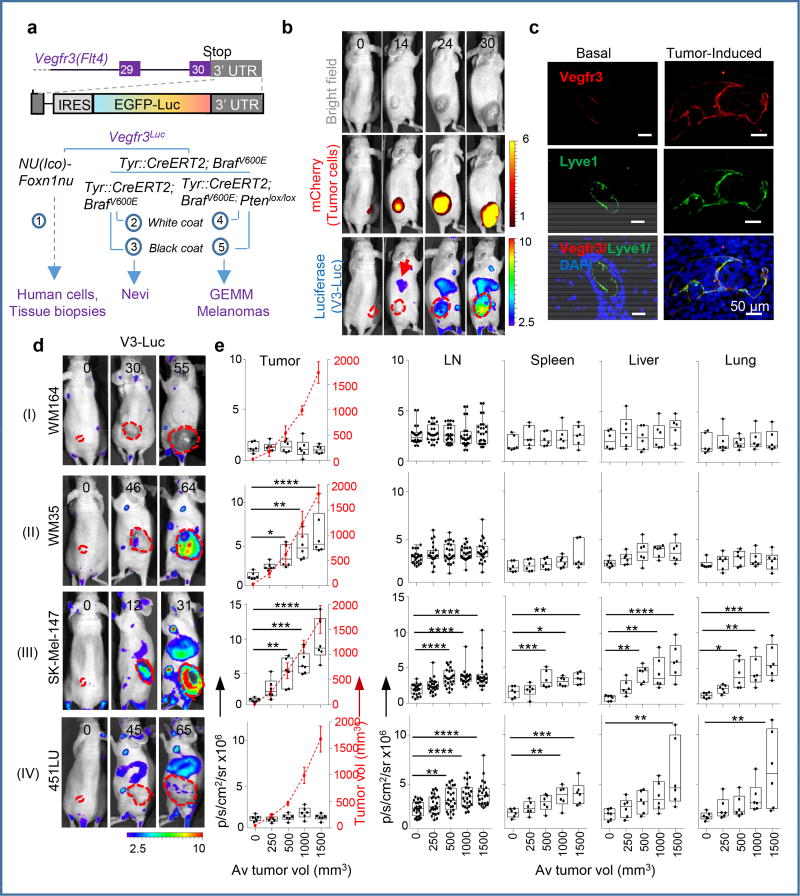
Figure 1. Vegfr3Luc reporter mice for whole-body analysis of benign and malignant melanocytic lesions.
a, Vegfr3Luc mouse models in this study. b, Xenografts of mCherry-SK-Mel-147 imaged as indicated. c, Confocal immunomicroscopy of Vegfr3 (red) and Lyve1 (green) in normal skin or in xenografts by SK-Mel-147. d, Four main patterns (I–IV) of V3-Luc emission identified by whole-body bioluminescence of xenografts of the indicated melanoma cell lines. Numbers represent days upon implantation and dotted lines tumor area. e, V3-Luc at the indicated locations and tumor sizes. Average tumor volumes are indicated in the X-axis, and visualized with a dotted red line for simplicity. Data are mean ± SD (6 mice per condition, 24 LN per cell line). One-way Anova/Dunnett's correction for multiple comparisons. Fluorescence: p/s/cm2/sr ×109; bioluminescence: p/s/cm2/sr ×106. See Source Data for V3-Luc quantifications in panel (e).

