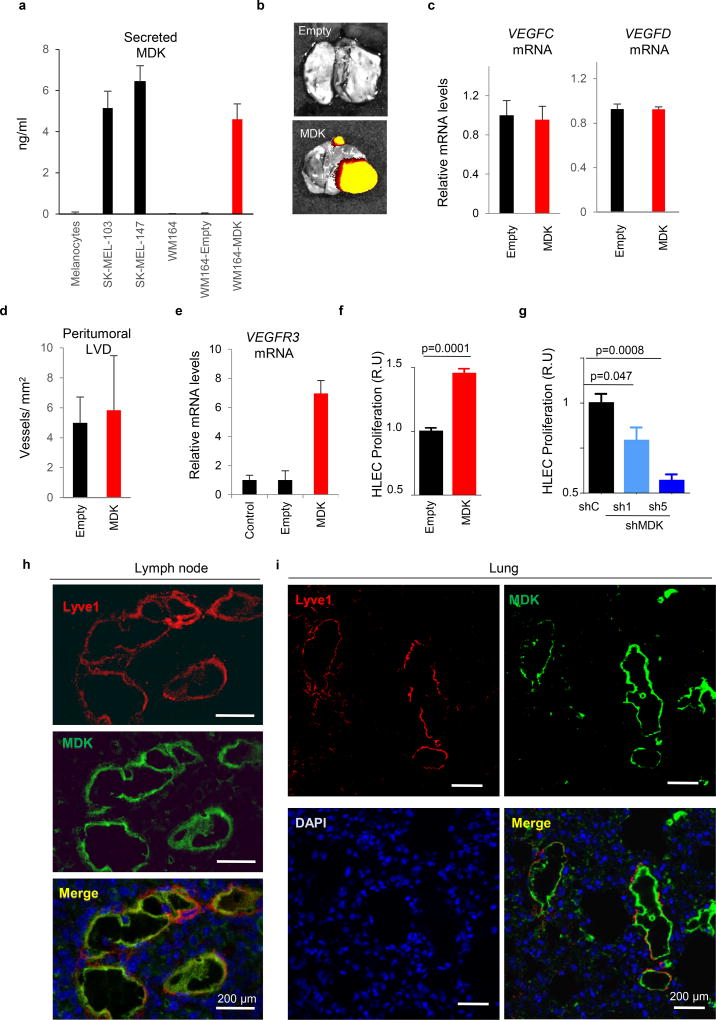
Extended Data Figure 6. MDK accumulates at sites of neo-lymphangiogenesis.
a, Relative expression of secreted MDK in WM164 infected with control (empty) or lentiviruses expressing MDK cDNA (right), analyzed in parallel with respect to basal levels in primary melanocytes and the indicated cell lines (left). Data correspond to biological triplicates measured by ELISA, using purified recombinant protein as a reference for quantification. b, Representative images of lung metastases identified by mCherry fluorescence. c, qRT-PCR analysis of VEGFC (left panel) and VEGFD (right panel) mRNA showing minimal changes in control vs MDK-overexpressing WM164 cells. d, Assessment of peritumoral lymphatic vessel density (Lyve1 staining) in consecutive histological sections of xenografts generated by WM164 expressing MDK (and their parental controls). e, Increased VEGFR3 mRNA in MDK-expressing HLEC, determined by qRT-PCR. Data in graphs a-d correspond to mean ± SD of 3 biological replicates. f, Proliferative capacity of human LEC (HLEC) incubated with conditioned media from control- or MDK-overexpressing WM164 (left panels, red). Statistical analysis: t-Test. The converse analysis, namely, depletion of MDK in SK-Mel-147 is shown in g, (blue). Data are represented as the relative mean ± SD of three biological replicates. Statistical analysis: One-way ANOVA. h, Dual immunofluorescence analysis to visualize MDK (green) and lymphatic vessels (Lyve1, red) in Vegfr3Luc positive lymph nodes of mice implanted with WM164-expressing MDK. The equivalent analysis in lungs is shown in i.

