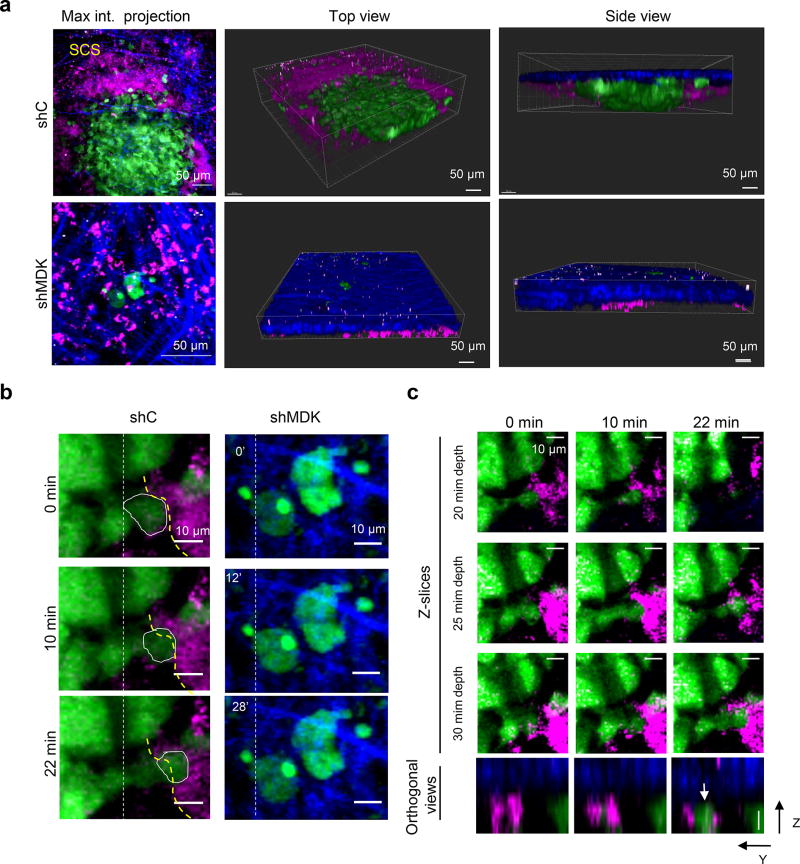
Extended Figure 8. Intravital multiphoton imaging of lymph node metastases from melanoma cells expressing or lacking MDK.
a, Maximum projection, top views or side views of lymph nodes from representative mice three weeks after implantation of SK-Mel-147 labeled with GFP and transduced with control shRNA (shC, upper panels) or MKD shRNA (shMDK, bottom panels). Tumor cells are visualized by green fluorescence, and collagen fibers by second harmonic generation (blue). Vessels at the subcapsular sinus (SCS) are stained with 155KD dextran (magenta). Note the horizontal and vertical growth of shC cells (i.e. metastasis expressing MDK), and the dissorganization of the surrounding SCS. Instead, shMDK cells were identified as single cells or rare micrometastases. Scale bar 50 microns b, Still images showing the differential intralesional motility of the indicated SK-Mel-147 cell populations from lesions in (a). The yellow dotted lines are shown to visualize the border of a dextran-labeled vessel in the context of a highly motile shC-melanoma cell (encircled with a solid white line). Vertical dotted white lines are included as reference to track cell movements. Scale bar 10 microns. c, Z-slices at different time points from the time images in (b). Bottom panels correspond to orthogonal Z-Y views at the indicated time points to show the three dimensional location of the cell (circled in b and marked with an arrow in c) with respect to the lymphatic vasculature. Scale bar 10 microns. Blue: Second harmonic generation, collagen; green: tumor cells; magenta: lymphatic vasculature.

