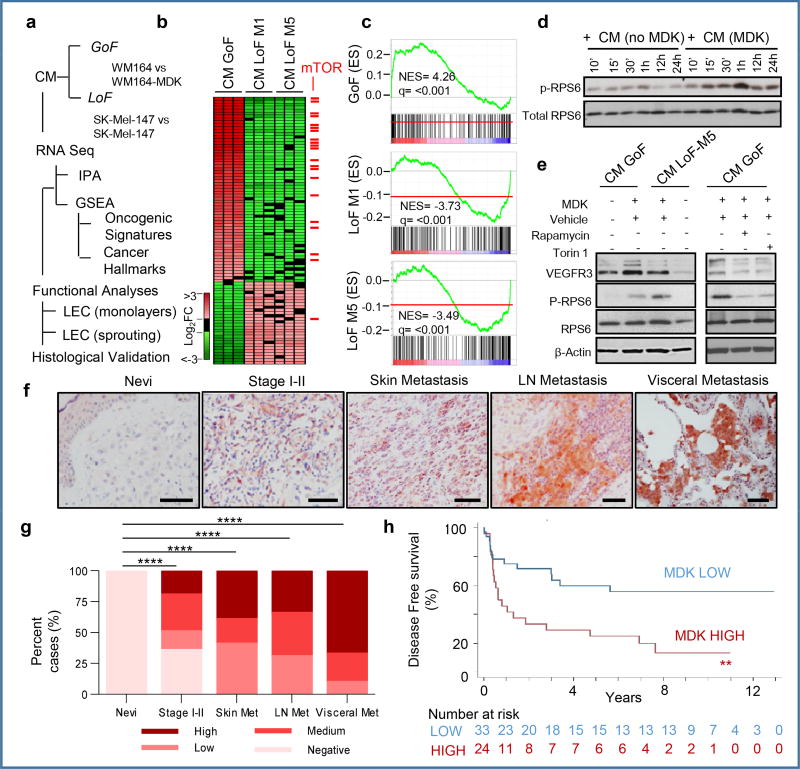
Figure 4. MIDKINE activates the mTOR pathway and is an indicator of poor prognosis in melanoma.
a, Identification of downstream effectors of MDK in LEC by RNA-seq and the corresponding validation analyses. b, Heatmap of deregulated genes (fold change >1.5), with mTOR pathway-associated factors in red. c, Enrichment score plots for mTOR-related pathways. d, Time-course analyses of RPS6 phosphorylation in LEC incubated with CM from control or MDK-GoF analyses. e, Visualization by immunoblotting of the impact of conditioned media (CM-GoF or CM-LoF) on VEGFR3, and total and phosphorylated RPS6 in human LEC. When indicated, LECs were incubated with the mTOR inhibitors rapamycin (1 µM) or torin 1 (10 nM). f, MDK immunohistochemistry (pink) in paraffin sections of the indicated human biopsies, with data quantified in (g). h, Kaplan-Meier survival curves of melanoma patients (Stage II–IV) classified on the basis of low and high-MDK expression in the corresponding sentinel LN. Fisher's exact test.

