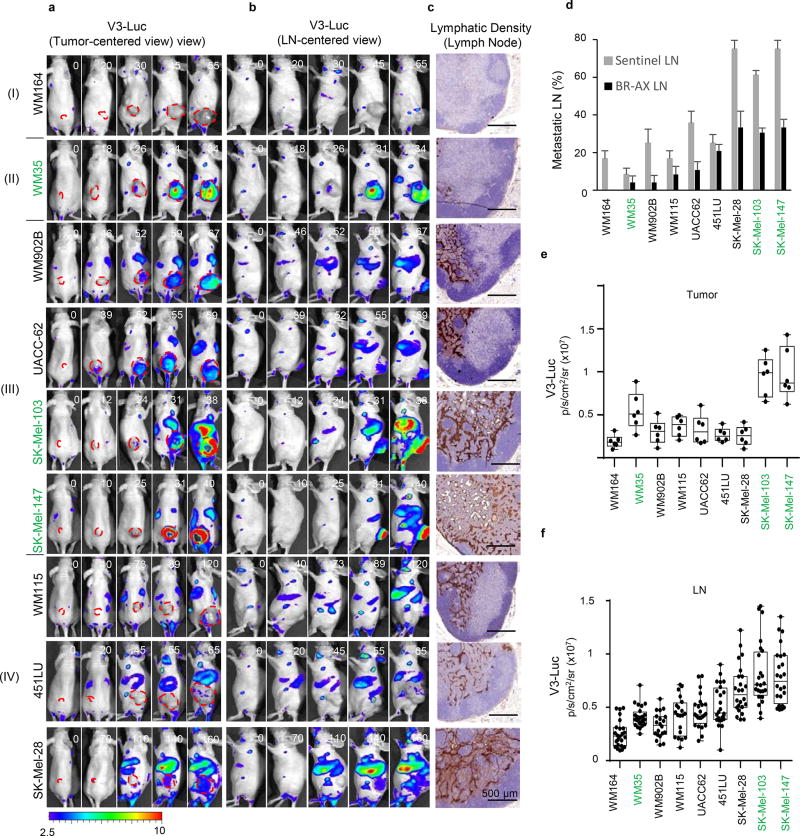
Extended Data Figure 2. Assessment of metastatic potential of melanoma cell lines in Vegfr3Luc mice.
a–b, Tumor-associated bioluminiscence driven by subcutaneous implantation of the indicated cell lines (labeled with mCherry) in Vegfr3Luc nu/nu mice, with images centered on the tumor (a) or showing the lateral flank of the mice to visualize sentinel-inguinal and brachial LN, as well as signal from spleen liver and lung (b). Four main patterns (I–IV) of Vegfr3Luc emission identified by are shown. Red lines mark the tumor area as detected by mCherry emission (data not shown). c, Detection of the lymphatic marker Lyve1 in histological sections of sentinel LN of xenografts generated as in (a), and euthanized when primary tumors reached 1500 mm3. d, Tumor-positive LN (Sentinel, Brachial and Axillar) in xenografts of the indicated cell lines. e, Relative V3-Luc signal in subcutaneous xenografts generated by the indicated cell lines. The average signal in sentinel and brachial LN are shown in (f). Data correspond to mean ± SE (minimum 6 mice per condition, 24 lymph nodes per cell line).

