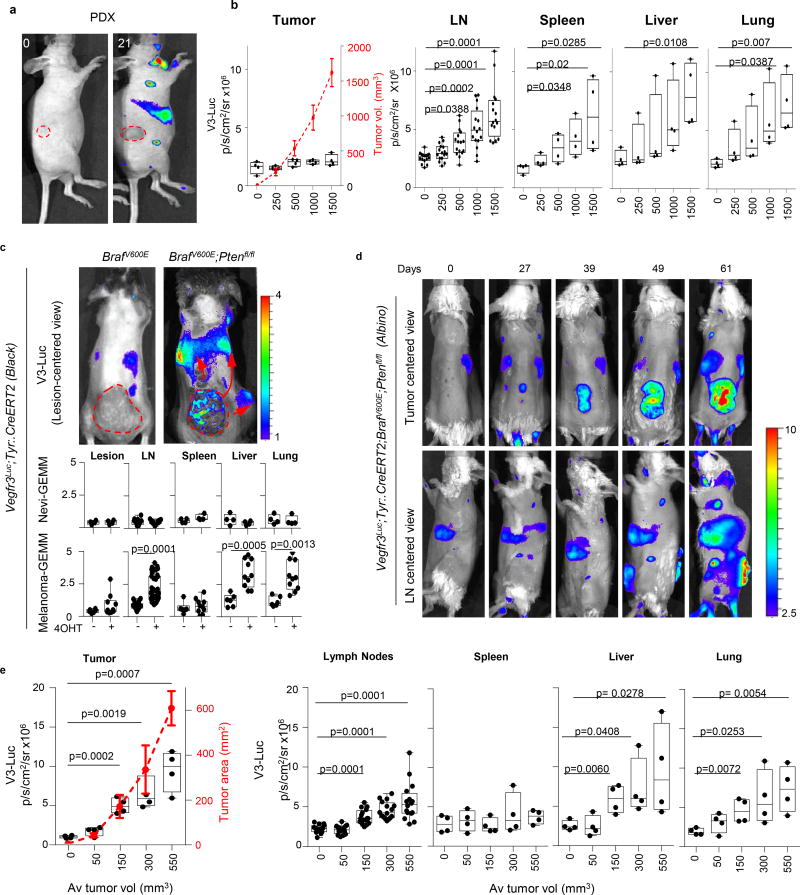
Extended Data Figure 3. Whole-body analysis of neo-lymhangiogenesis induced in immunodeficient and immunocompetent genetically engineered mouse models (GEMM).
a, Imaging of luciferase induction by a patient-derived xenograft isolated from a skin melanoma metastasis and implanted in Vegfr3Luc nu/nu mice. Animals were imaged at different time points to show distal lymph nodes induced prior detection of V3-Luc at the subcutaneous lesion. Dashed red lines mark tumor area. Scale p/s/cm2/sr (×106). b, Quantification of the luciferase signal in tumor, LN (sentinel and brachial sites), spleen, liver and lung, at the defined average tumor sizes indicated in the X-axis (visualized with a dotted red line for simplicity). Specific tumor volumes are indicated in the right Y-axis. Bioluminescence data correspond to mean ± SD (4 mice per condition, 16 lymph nodes per PDX). Statistical analysis: t-test. c, Comparative imaging of V3-Luc emission by benign nevi and cutaneous melanomas generated respectively in Tyr::CreERT2-inducible BrafV600E or BrafV600E; Ptenlox/lox mice (black coat background), imaged 4 weeks after topical administration of 4-OH-tamoxifen. Arrows mark systemic activation of luciferase. (Bottom), Quantification of luciferase signal in tumor, sentinel and brachial LN, spleen, liver and lung. Units: p/s/cm2/sr (×106). Data correspond to mean ± SD (4 mice for nevi and 10 animals for melanoma). Statistical analysis: One-way Anova with Dunnett's test for multiple corrections. d, Luciferase emission induced by cutaneous melanomas generated in immunocompetent Vegfr3Luc; BrafV600E; Ptenlox/lox (albino), visualized at the indicated times after topical administration of 4-OH-tamoxifen. e, Quantification of the luciferase signal in the indicated organs, as defined in the Methods section. The average tumor size in each point is indicated by a red doted line and in the x-axis. Data correspond to mean ± SD (4 mice per condition). Statistical analysis: t-test.

