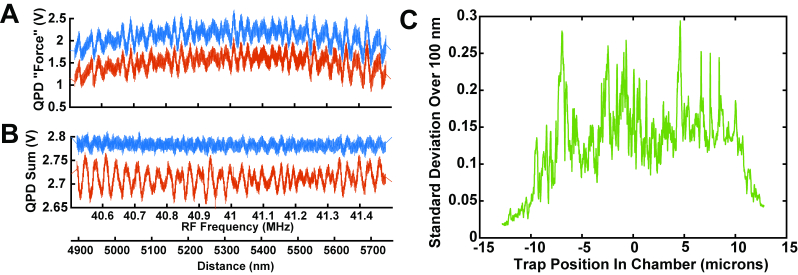
Fig. 3.
A) Example of variations in the force signal observed with the AOD beam steering system as a function of beam position. The y-axis shows the differential voltage from the QPD as the trap position was scanned in the chamber without any trapped bead. Similar variations were seen when the bead was present but were visually masked by Brownian motions. The variations are shown without (red) and with (blue) intensity-maintaining feedback. The two signals overlay nearly perfectly and are displayed with an offset for clarity. The two x-axis scales below panel B apply both to panels A and B. B) The total intensity of the light reaching the QPD also varies with a similar periodicity. Using an independent feedback loop to maintain a constant total QPD illumination (B, blue), did not eliminate the variations in force signals. C) The standard deviations of the fluctuations over a 100 nm window were calculated over the entire 25 μm deflection range of the AOD. Some positions (corresponding to particular RF frequencies) exhibited much larger variations in the recorded force signal than the average. The y-axis scale in C corresponds approximately to pN using typical experimental calibrations.

