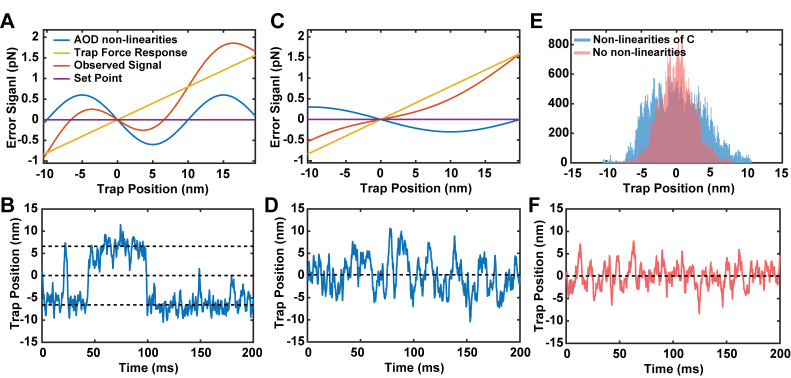
Fig. 5.
A) Simulated error signals for a trapped bead undergoing Brownian motion. The total measured error signal as a function of trap position (red) includes the Hookean (linear) trap force (yellow) and the imposed variations from the AOD (blue) modeled as a sinusoidal curve. Due to the influence of the AOD force variations, there are two possible trap positions (−7 nm and + 7 nm) where the force will be stabilized at the set point (zero error signal, purple). B) Simulated trap positions for the potential in A using parameters similar to our experiments. The trap position quickly jumps between the values where the total measured force is equal to the set point (horizontal dashed lines show intercepts of red and purple curves from A. C) A reduction in the amplitude of the variations and doubling of their spacing changes the profile of the measured error response (red), effectively reducing the loop gain. D) Simulated trap positions from the profiles in C show that large jumps are no longer observed, but the small AOD variations introduce added noise. E) A comparison of the simulated trap positions with the low levels of non-linearity shown in Panel C (blue histogram) compared with simulated positions without non-linearities (pink histogram). F) Simulated trap positions under feedback when only the trap’s potential is present and non-linearities are absent.

