Figure 2. The ribosome test case.
(A) The ribosome consensus map with the three transparent body masks (LSU, SSU and head) superimposed. (B) Slices through the density of the three bodies after the consensus refinement (top) and after multi-body refinement (down). (C) Local resolution estimates (in Å) calculated in relion after the consensus refinement (left) and after multi-body refinement (right). (D) The contributions of all eigenvectors to the variance. The first eigenvector, for which the maps at the extremes are shown in panel F, is highlighted in red. (E) Histograms of the amplitudes along the first and second eigenvectors for all particle images in the data set. The histogram of the amplitudes along the first eigenvector shows a bimodal distribution. The data set was split into two subsets: particle images with the amplitude along the first eigenvector smaller than −14 (red arrow) and particle images with that amplitude larger than −14 (blue arrow). (F) Refined maps for the two subsets in the same colors. As observed in the movie along the first eigenvector, the SSU rolls with respect to the the LSU and the head swivels with respect to the SSU, cf Video 1.

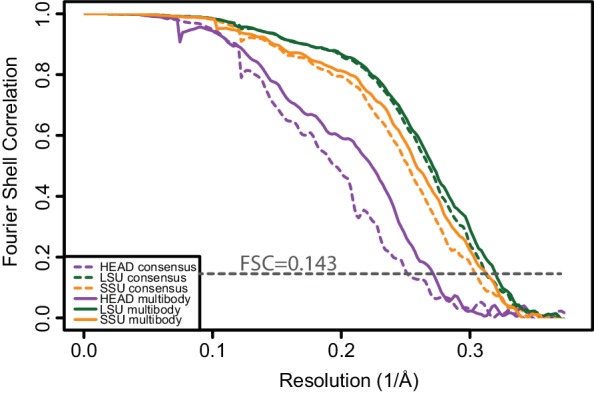
Figure 2—figure supplement 1. Fourier shell correlation curves calculated from independently refined halves of the data for the three bodies after consensus refinement (dashed lines) and after the second multi-body refinement (solid lines).