
Figure 1. Novel DAPK1 intronic TSSs arise upon epigenetic drug treatment.
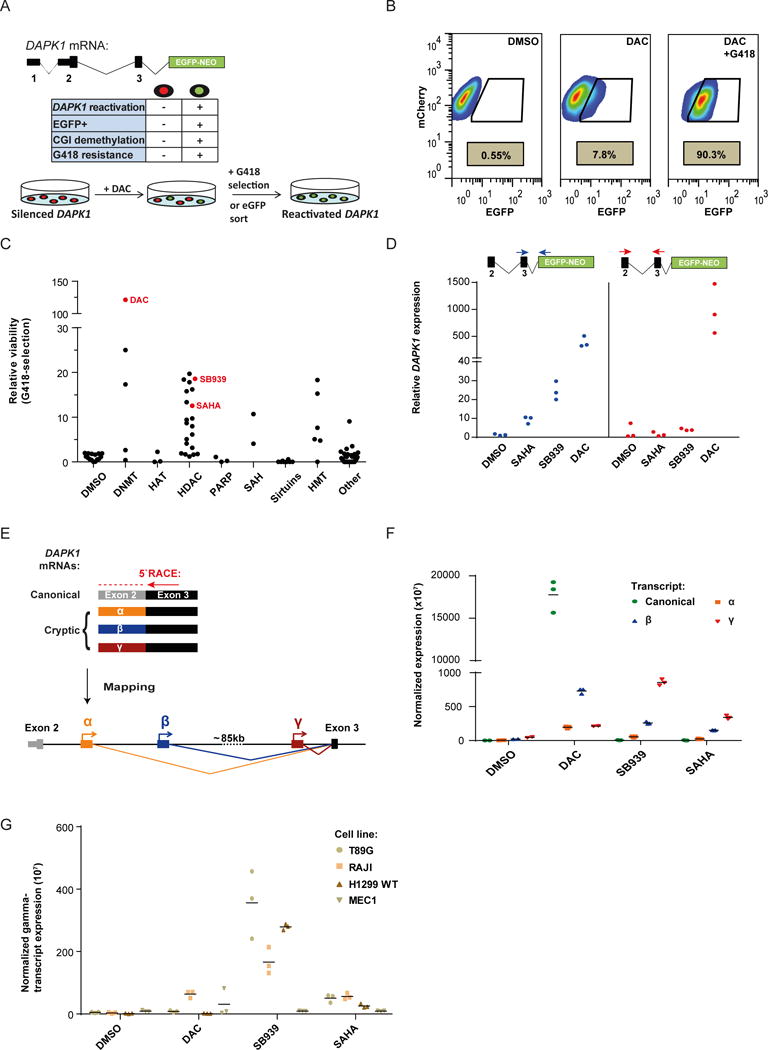
a) A fluorescence/resistance marker was introduced into one allele of the DAPK1 locus epigenetically silenced in NCI-H1299 cells. Administration of the DNA demethylating agent DAC reactivates a subpopulation of cells (green coloring).The key characteristics of DAPK1 silenced (red) and reactivated (green) cells are shown in the central table. CGI = CpG island.
b) FACS analysis showing the percentage of EGFP positive reporter cells before (left) and after DAC treatment with (right) or without (middle) additional G418 selection.
c) NCI-H1299 reporter cell viability after epigenetic compound treatment and G418 selection relative to DMSO controls. Data is sorted by inhibitor class: DNMT=DNA methyltransferase; HAT=Histone acetyltransferase; HDAC=Histone deacetylase; PARP=Poly(ADP-ribose)-Polymerase; SAH=S-Adenosyl-L-homocysteine; SIRT=Sirtuins; HMT=Histone methyltransferase.
d) DAPK1 expression after DNMTi and HDACi treatment of NCI-H1299 reporter cells relative to DMSO. qRT-PCR analysis was performed using primers located either in DAPK1 exon 2 and 3 (blue) or in exon 3 and the fluorescence/resistance marker (red).
e) Three cryptic 5′ exons (α, β and γ) were identified by 5′RACE performed on RNA from HDACi treated cells. All cryptic transcripts spliced to the canonical DAPK1 exon 3. γ: chr9 90219272 -90219341; β: chr9 90134907 - 90135007; α: chr9 90125477 - 90125599
f) qRT-PCR expression analysis of canonical DAPK1 or cryptic transcripts(α, β, and γ) across treatments relative to housekeeping genes.Vertical line represents the mean from three independent experiments.
g) Expression of the DAPK1 γ-transcript relative to housekeeping genes in untreated and treated cell lines. Vertical line represents the mean from three independent experiments.