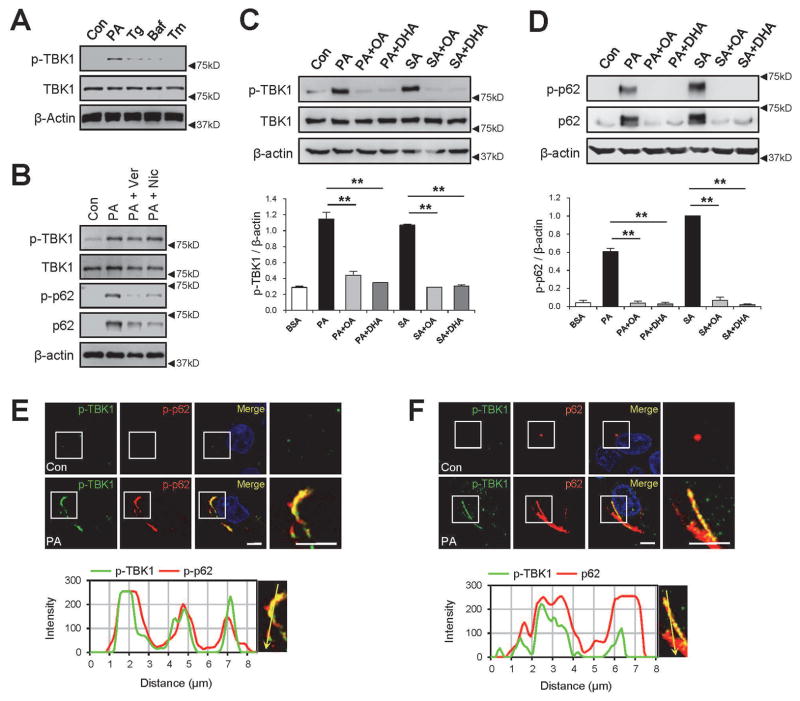
Fig. 2.
SFA induces TBK1 activation and aggregation with phosphorylated p62. HepG2 cells were treated with BSA (Con), palmitic acid (PA, 500 μM), thapsigargin (Tg, 1μM), bafilomycin A1 (Baf, 100 nM), tunicamycin (Tm, 5 μg/ml), verapamil (Ver, 50 μM), nicardipine (Nic, 100 μM), stearic acid (SA, 500 μM), oleic acid (OA, 500 μM), and/or docosahexaenoic acid (DHA, 500 μM) for 9 h, followed by immunoblotting (A–D), immunoblot quantification (C,D; lower panels) and immunostaining (E,F). Immunostained images of PA-treated cells (upper panels) were analyzed by line-scan evaluation of each signal across protein inclusions (lower panels). Scale bars, 5 μm. Quantification data are shown as mean ± s.e.m. **P < 0.01 (Student’s t-test). Arrowheads indicate the exact or nearest position of the protein molecular weight markers (kD).

