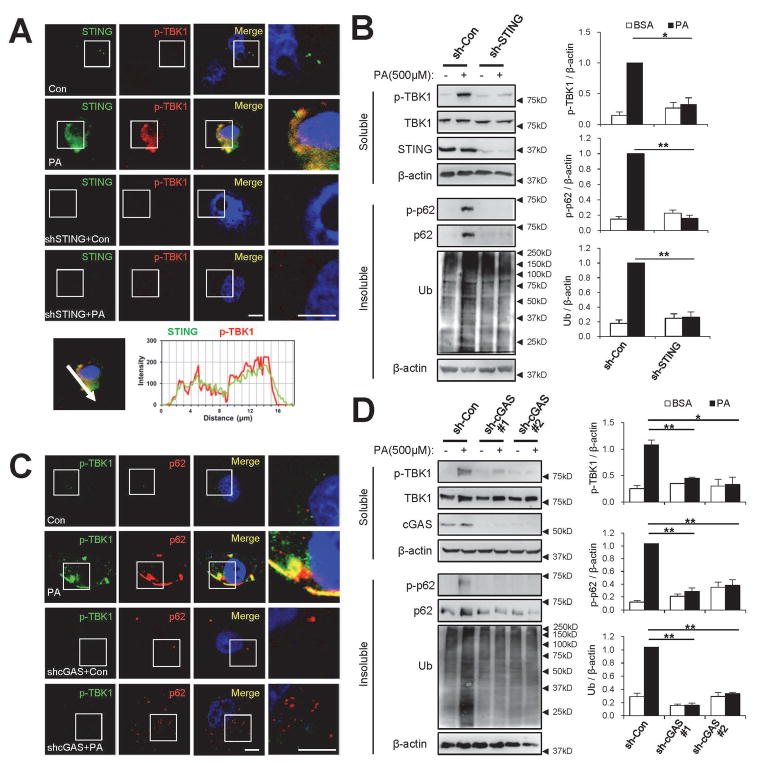
Fig. 4.
The cGAS-STING axis mediates SFA-induced activation of TBK1. At 48 hr after infection with shRNA lentiviruses for luciferase (sh-Con), STING (sh-STING) or cGAS (sh-cGAS#1 and #2), HepG2 cells were treated with BSA (Con) or PA (500 μM) for 9 hr. Then the cells were subjected to immunostaining (A,C), subcellular fractionation and immunoblotting (B,D; left panels) and immunoblot quantification (B,D; right panels). Boxed areas in fluorescence images are magnified in rightmost panels. Immunostained images of PA-treated control cells (A, upper panel) were analyzed by line-scan evaluation of each signal across protein inclusions (A, lower panel). Scale bars, 5 μm. Quantification data are shown as mean ± s.e.m. *P < 0.05, **P < 0.01 (Student’s t-test). Arrowheads indicate the exact or nearest position of the protein molecular weight markers (kD).

