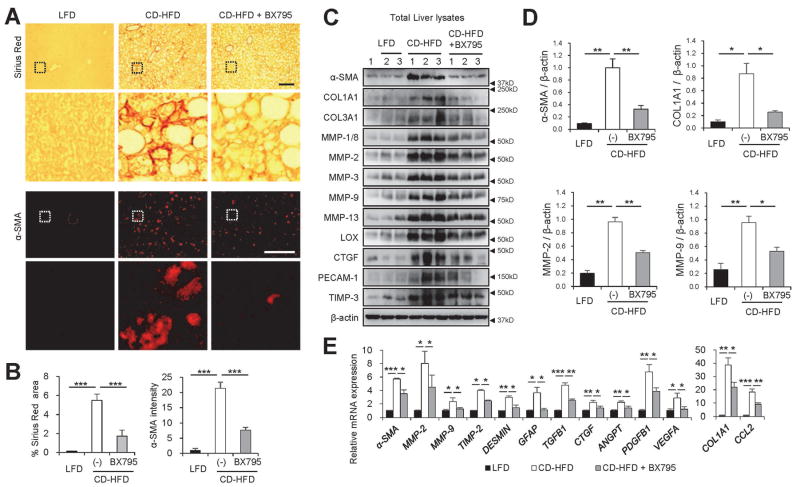
Fig. 7.
Inhibition of TBK1 suppresses liver fibrosis induced by NASH. (A–E) The mice described in Fig. 6 were also analyzed by the following experiments. (A) Liver sections were subjected to Sirius Red staining and α-smooth muscle actin (α-SMA) immunostaining. Scale bars, 200 μm. Boxed areas are magnified in the bottom panel. (B) Areas positive for Sirius Red (left panel) or α-SMA fluorescence intensity (right panel) were quantified. (C and D) Total liver lysates were analyzed by immunoblotting (C) and immunoblot quantification (D). (E) Relative mRNA expression was quantified through RT-PCR. All data are shown as mean ± s.e.m. *P < 0.05, **P < 0.01, ***P < 0.001 (Student’s t-test). Arrowheads indicate the exact or nearest position of the protein molecular weight markers (kD).

