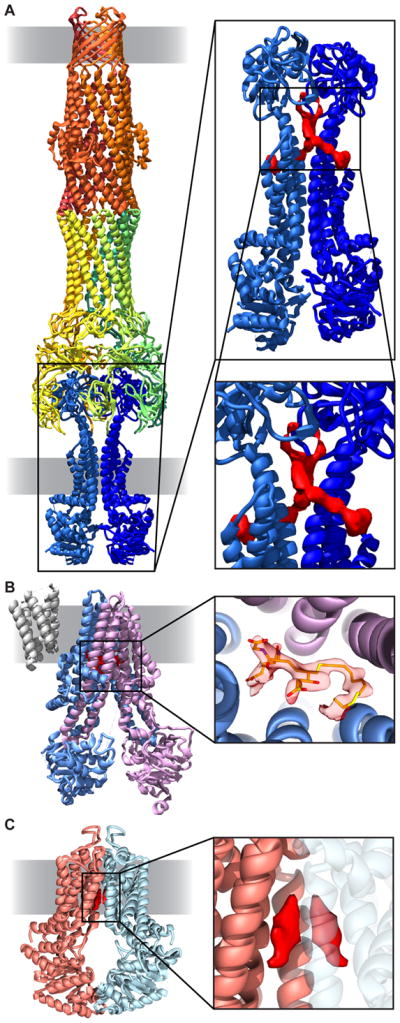
Figure 2.

Visualization of small molecules bound to membrane proteins. (A) Structure of the MacAB-TolC drug efflux pump (left). TolC (orange), MacA (yellow and green), and MacB (blue) are shown in ribbon form. Extra density (red) is visible in potential substrate binding pocket (right, EMD 3653, PDB 5NIK) [15]. (B) Multidrug resistance protein (MRP1) with density for bound leukotriene C4. MRP1 subunits (purple, blue) are shown in ribbon (left); density for leukotriene C4 (orange) is visible in the structure (right, EMD 8560, PDB 5UJ9) [16]. (C) ABCG2 transporter (ribbon, orange and blue) with density (red) for cholesterol (EMD 3654, PDB 5NJ3) [17].
