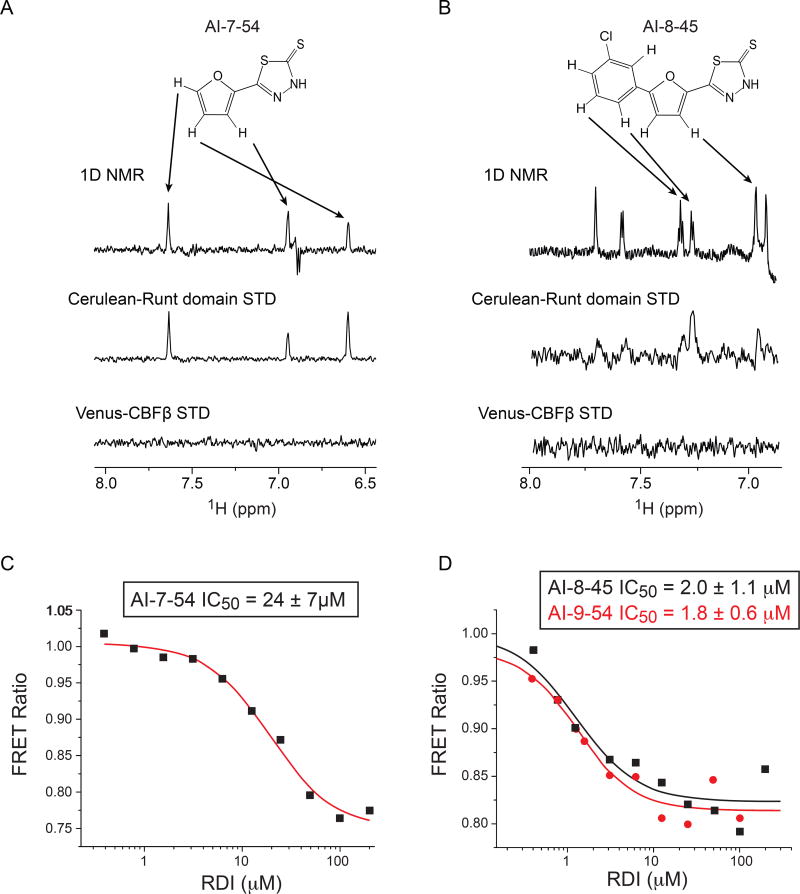
Figure 2. NMR STD and FRET data for Runt domain inhibitors.
A. Results of NMR saturation transfer (STD) analysis for AI-7–54. The structure of AI-7–54 is shown with a 1D 1H NMR spectrum of the compound below. Arrows indicate resonance assignments. The middle spectrum shows 1D difference spectrum for Cerulean-Runt domain + AI-7–54. Bottom spectrum shows 1D difference spectrum for Venus-CBFβ, demonstrating a lack of binding.
B. Results of STD analysis for AI-8–45, as in panel A.
C,D. Results of FRET analysis for the initial lead AI-7–54 (C) and optimized compounds AI-8–45 and AI-9–54 (D). Calculated IC50 values (average of two measurements ± standard deviation) are shown.

