
Fig. 3.
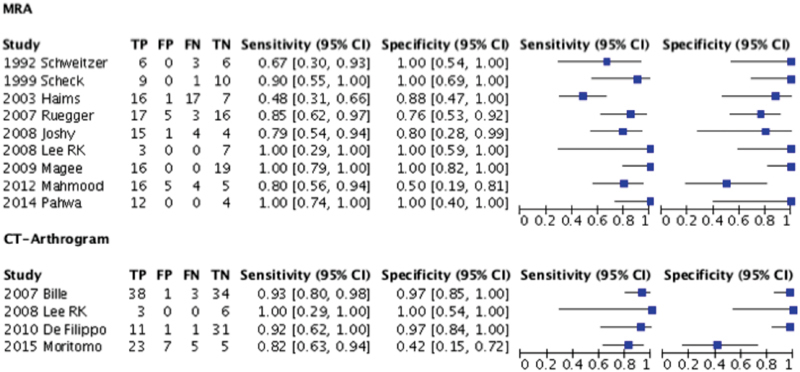
Forest plots of the diagnostic statistics of individual studies using MRA versus CT arthrogram for the diagnosis of triangular fibrocartilaginous complex tears. CI, confidence interval; CT, computed tomography; FN, false negatives; FP, false positives; FN, false negatives; MRA, magnetic resonance arthrography; TN, true negatives; TP, true positives.