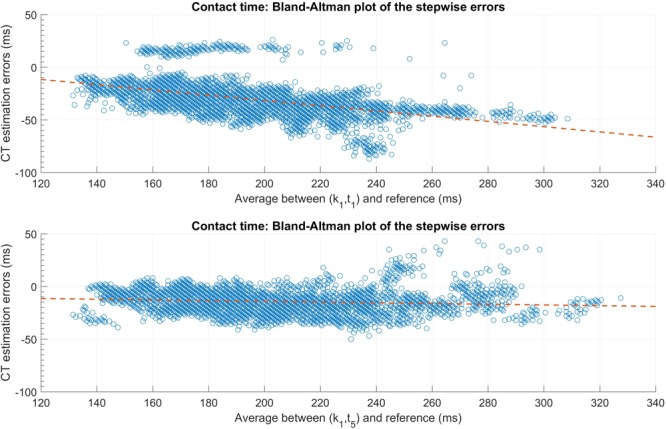
FIGURE 4.

Bland-Altman plot of the ground contact time (CT) estimation errors for the (k1, t1) (top graph) and (k1, t5) (bottom graph) candidates. The error is measured on all the steps of the development set (N = 4836). The orange dashed line represent the best linear fit according to the least square method.
