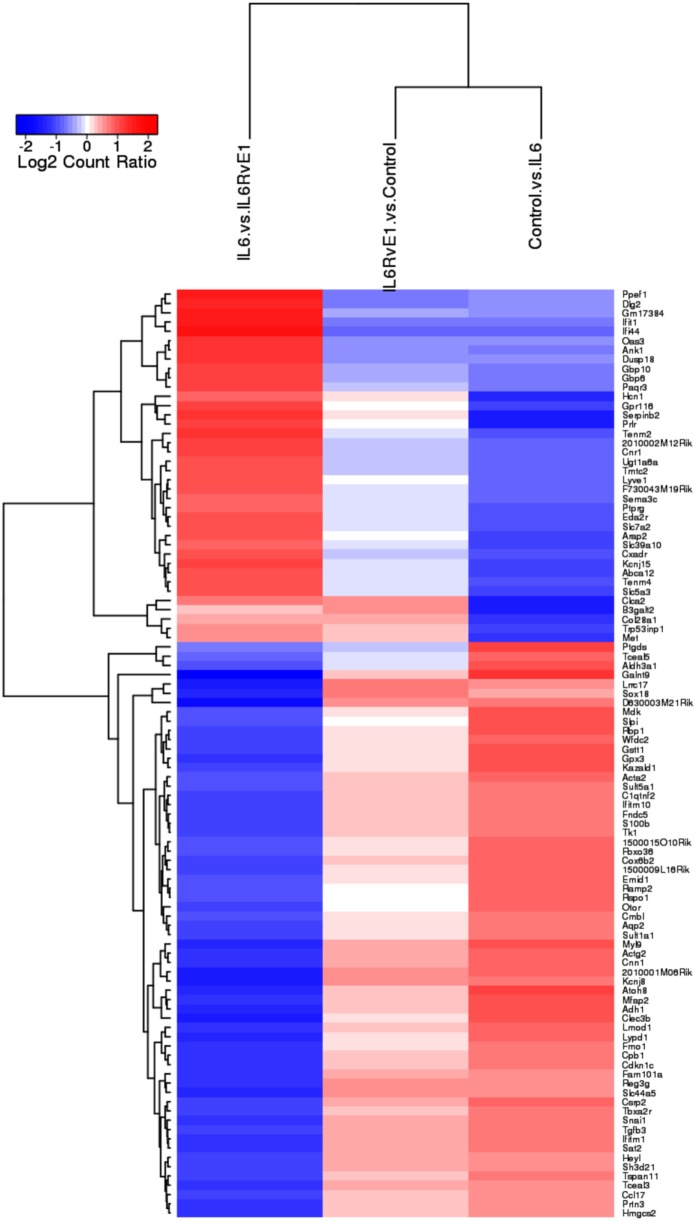
Figure 3.
Gene expression shift with resolvin E1 (RvE1) treatment. A heat map of top 100 differentially expressed genes (absolute log2 fold change) compares OB + interleukin (IL)-6 vs. OB alone, OB + IL-6 + RvE1 vs. OB alone, and OB + IL-6 + RvE1 vs. cells + IL-6. The color intensity reflects the level of log2 fold change for each comparison with red for upregulation and blue for downregulation. Fainter colors indicate lesser changes in gene expression between the groups being compared. Genes were ordered based on a dendrogram derived from hierarchical clustering of log2 values of all rows; genes with similar differential expression patterns were grouped together. The result demonstrates a remarkable mirror image change in gene expression. Results are expressed as mean of genes highly expressed.

