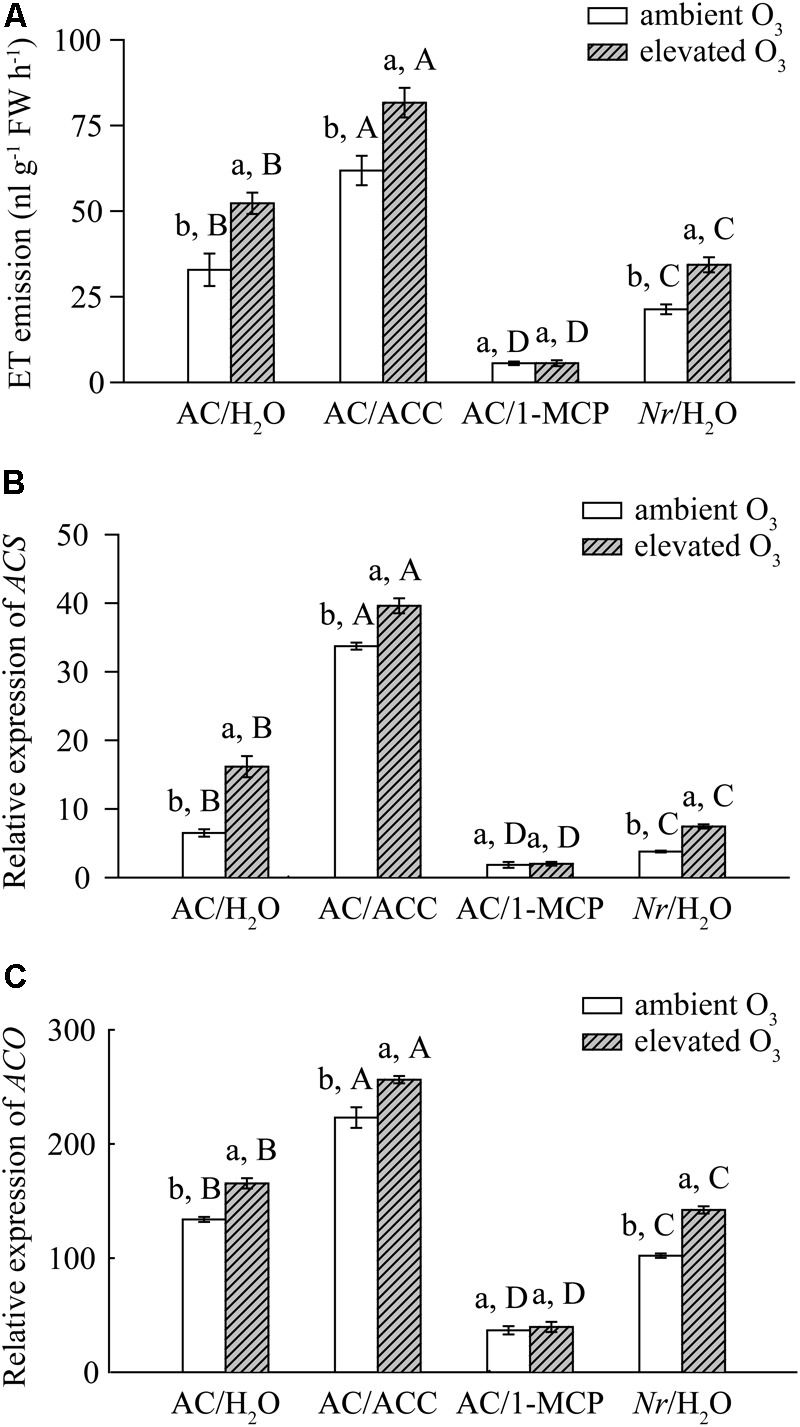
FIGURE 1.

The ET production rate and fold-change in the expression of ET synthesis genes of wild-type AC plants spraying with ACC, 1-MCP, and H2O, and of ET-insensitive Nr mutants spraying with H2O grown under ambient O3 and elevated O3. (A) ET production rate. (B) ACS. (C) ACO. Each value represents the mean (±SE) of four OTCs (10 plants for each treatment per OTC). Different lowercase letters indicate significant differences between ambient O3 and elevated O3 within the same genotype. Different uppercase letters indicate significant differences between genotypes following with ACC, 1-MCP, or H2O applications within the same O3 treatment.
