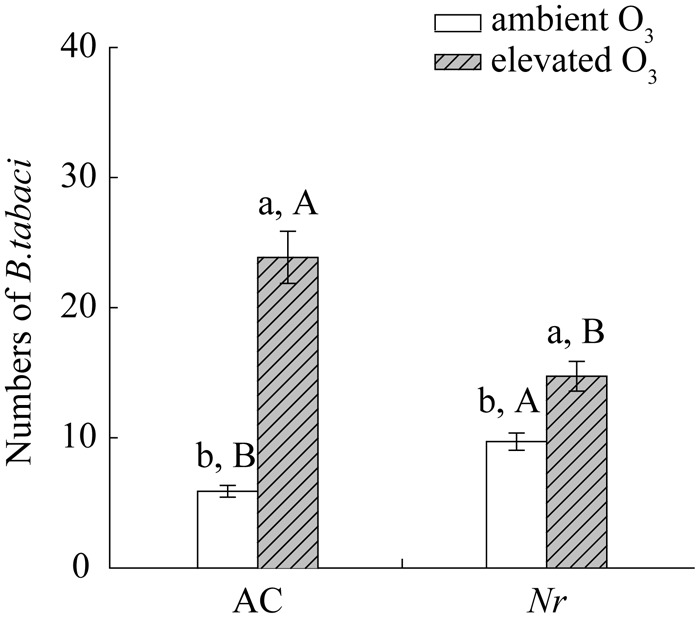
FIGURE 3.

Abundance of B. tabaci when fed on two tomato genotypes grown under ambient O3 and elevated O3. Each value represents the mean (±SE) of four OTCs (eight plants for each genotype per OTC). Different lowercase letters indicate significant differences between ambient O3 and elevated O3 within the same genotype. Different uppercase letters indicate significant differences between genotypes within the same O3 treatment.
