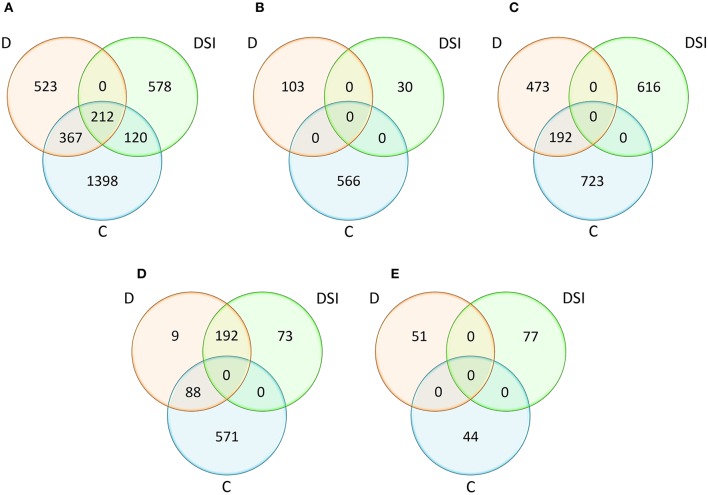
Figure 3.
Comparative analysis of the numbers of positional candidate genes identified within QTL confidence intervals with respect to the experiment variants (C, D, DSI) for all traits (A) and for the considered trait categories: plant water status (B), photosynthetic efficiency (C), osmoprotectant and hormone content (D), activity and accumulation of antioxidants (E). D, drought stress; C, control conditions; DSI, stress index.

