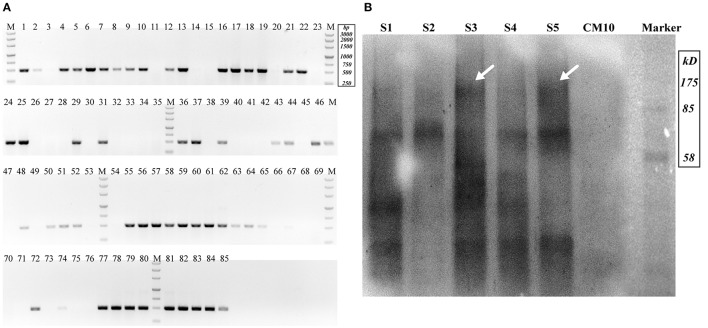
Figure 3.
Detection of Cas9-expressing transformants. (A) Nucleic acid gel electrophoresis analysis of putative Cas9 transformants (Expected target band was 491 bp). (B) Western blot for Cas9 detection (S1–S5 represented putative transformants; CM10 represented the negative control; the expected Cas9 band was 186.5 kDa and is indicated by arrows).

