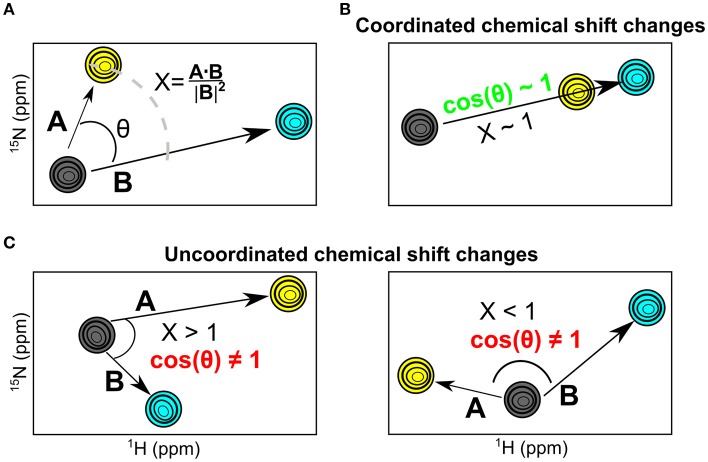
Figure 4.
The NMR chemical shift projection analysis (CHESPA). (A) Schematic representation of the CHESPA analysis showing 1H-15N HSQC chemical shift resonances of the apo (gray), 3′-UMP (yellow) and 5′-AMP (cyan) states. Vectors A, B correspond to the compounded chemical shifts calculated for 3′-UMP-bound and 5′-AMP-bound complexes relative to the apo state. The two projection analysis parameters, projection angle and fractional shift, were calculated as described in the section Methods. (B,C) Graphical representation of scenarios representing coordinated (B) and uncoordinated displacements (C) of the 1H-15N HSQC chemical shifts upon ligand binding.

