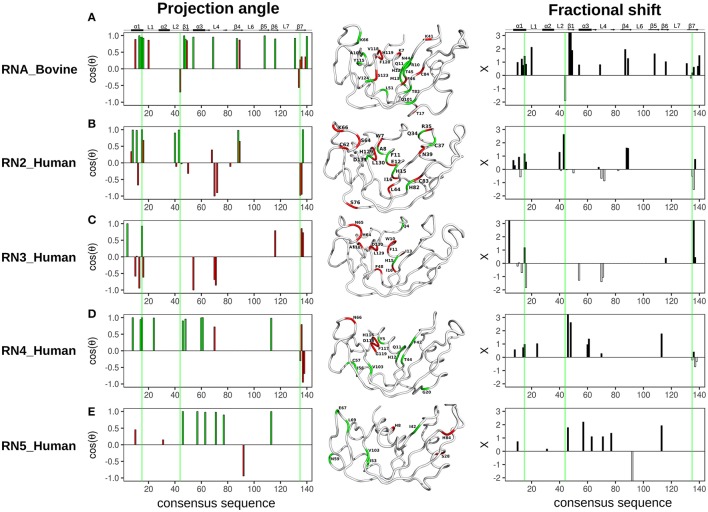
Figure 5.
Chemical shift projection analysis of 3′-UMP and 5′-AMP ligand binding to functionally distinct RNases. The projection angle (cos(θ), left) and the fractional shift (X, right), calculated for residues with Δδobs > 0.05 ppm at the highest ligand concentration, are plotted as a function of consensus sequence for bovine RNase A and human RNases 2–5 upon binding of 3′-UMP and 5′-AMP single nucleotide RNA ligands. (A–E) Residues showing cos(θ) ~ 0.9 are colored green (coordinated), those with cos(θ) < 0.9 are colored red (uncoordinated). Residues are also identified on the three-dimensional structures of the five RNases using tube representations in the color scheme described above. Fractional shifts as a function of consensus sequence for bovine RNase A and human RNases 2–5, respectively, are shown on the right. Residues displaying positive and negative fractional shifts are displayed using black and white bars, respectively. Active-site residues (His12, Lys41, His119, RNase A numbering) are highlighted using green lines. Secondary structure of bovine RNase A is traced on top of the sequence alignment using blocks, arrows and dashed lines to represent α-helix, β-strand and loop regions, respectively.

