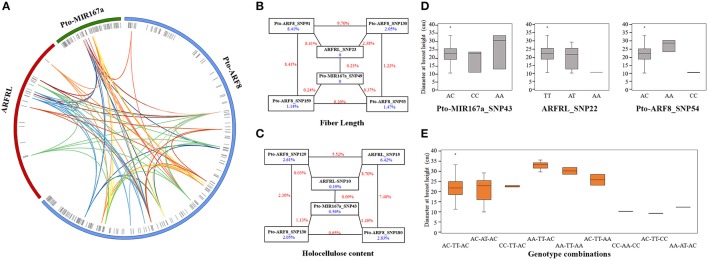
Figure 4.
Epistatic network among the SNPs in Pto-MIR167a and its targets, lncRNA gene ARFRL, and Pto-ARF8, and their epistatic effects on traits. (A) Structural network revealing the epistatic interactions of different loci of Pto-MIR167a, lncRNA gene ARFRL, and Pto-ARF8. The outer circles represent the three different genes. The middle circles indicate the SNP positions within the genes. The inner lines represent the pairwise interactions, with different colored lines representing for different traits, i.e., deep red, light blue, pink, orange, yellow, green, deep blue, red, blue, and deep orange indicate diameter at breast height, tree height, stem volume, fiber length, fiber width, microfibril angle, lignin content, α-cellulose content, holocellulose content, and hemicellulose content, respectively. (B,C) Interaction graphs for fiber length and holocellulose content among the SNPs of the three candidate genes. The blue values in boxes represent the single-marker effects, and the red values along the lines indicate pairwise effects. (D) Box plots depicting the single-locus effects of different genotypes of the three SNPs for phenotypic variations. (E) Boxes displaying the phenotypic values of different genotypic combinations of the three SNPs, Pto-MIR167a_SNP43, ARFRL_SNP22, and Pto-ARF8_SNP54.

