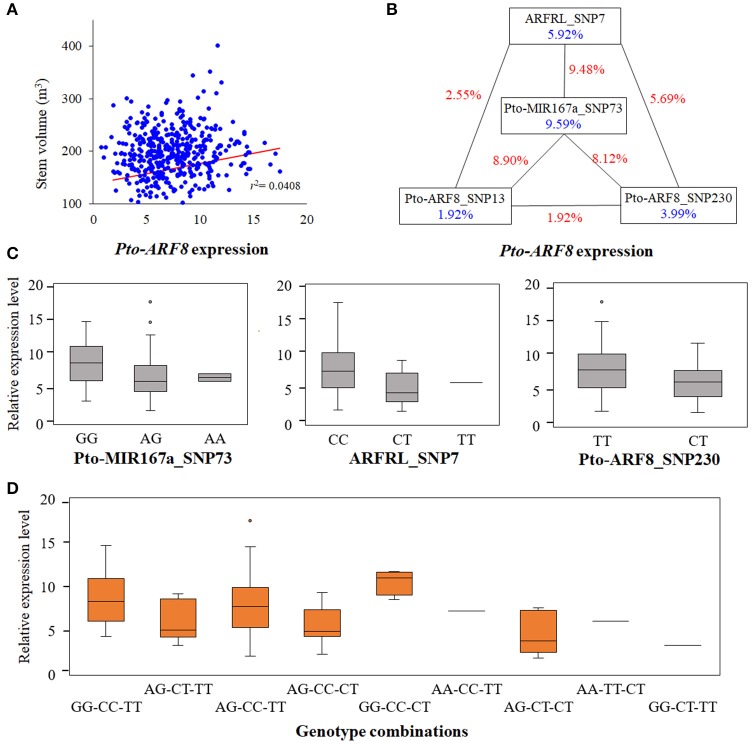
Figure 5.
Epistatic interactions of significant SNPs in Pto-ARF8 expression variation. (A) Correlation between stem volume variation and Pto-ARF8 expression levels detected by RT-qPCR. (B) Interaction graph of Pto-ARF8 expression among four significant SNPs in the three candidate genes. The blue values in boxes represent single-marker effects and the red values along the lines indicate the pairwise epistatic effects. (C) Box plots revealing the single-locus effects of different genotypes for expression traits of Pto-ARF8. (D) Boxes displaying the expression variation of different genotype combinations of three SNPs, Pto-MIR167a_SNP73, ARFRL_SNP7, and Pto-ARF8_SNP230.

