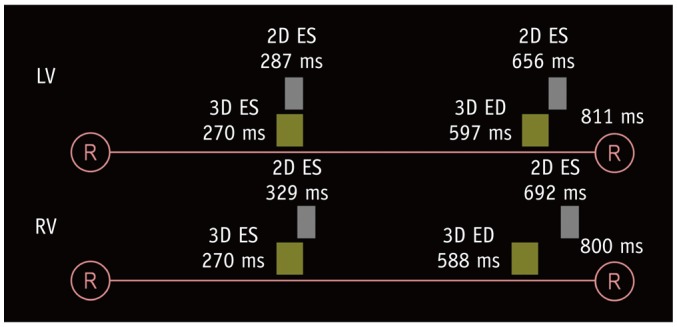
Fig. 3. Diagram illustrating ES and ED trigger delays for 2D short-axis cine MRI and 3D whole-heart MRI.

Compared with corresponded trigger delays of 2D short-axis cine MRI, shorter trigger delays of 3D whole-heart MRI are pronounced for ED phase and for right ventricle. RR intervals were calculated based on mean heart rates during examination. Temporal resolutions are different between 2D short-axis cine MRI (30–50 ms) and 3D whole-heart MRI (30–100 ms). ED = end-diastolic
